

Current Inflation: Inflation Rate in Germany 2026 – Development, Causes and Forecast

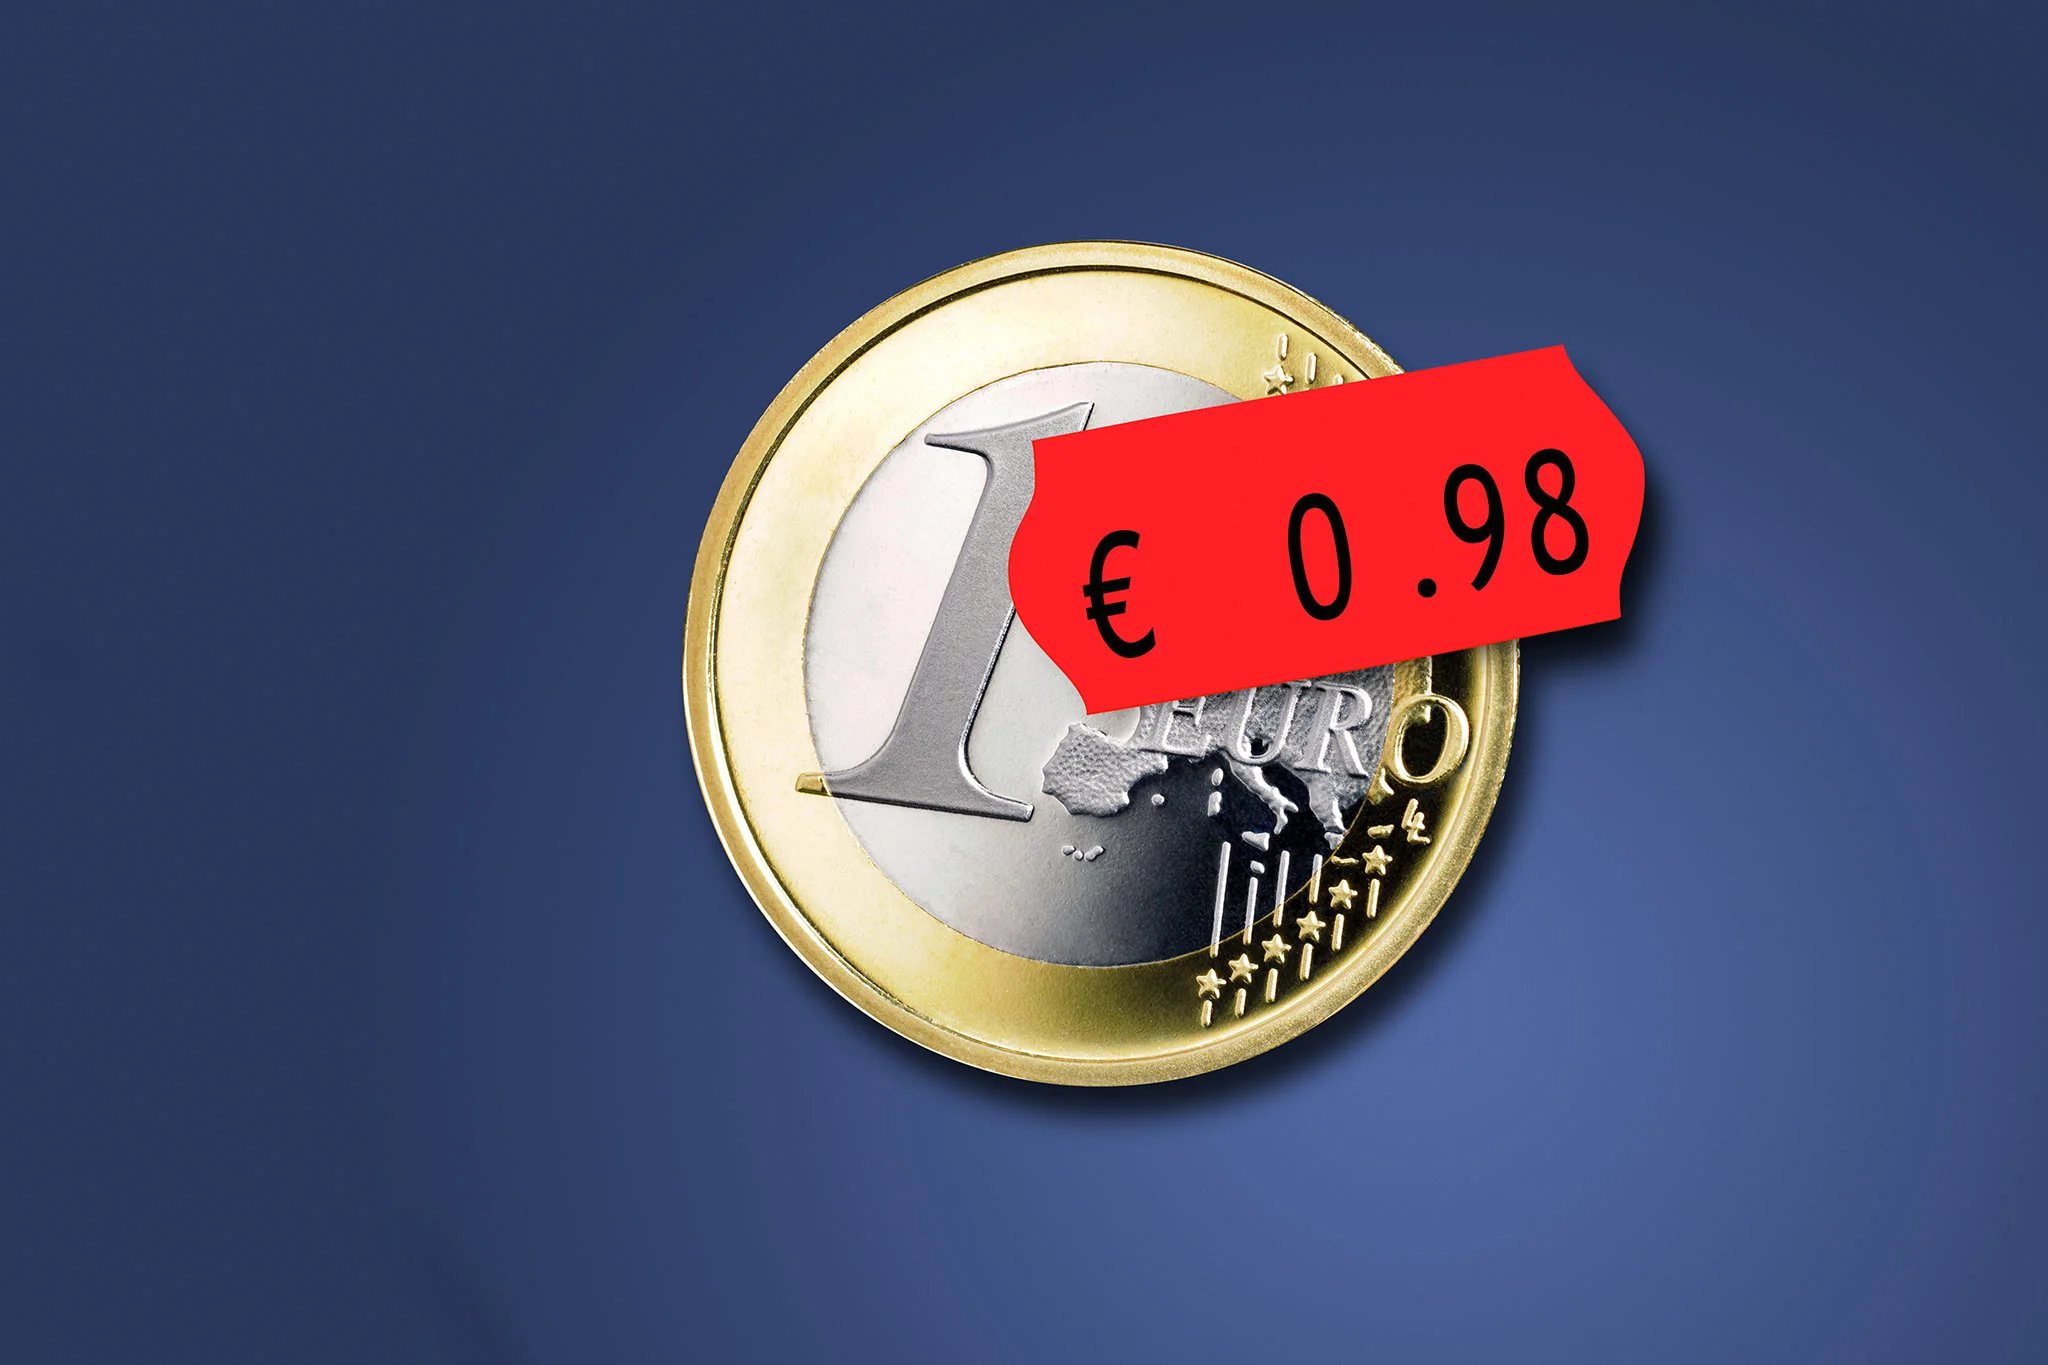
Inflation in Germany currently stands at 2.3% (June 2026, consumer price index compared to the same month last year). Following the crisis years of 2022 and 2023 with rates of 6.9% and 5.9% respectively, price increases had stabilized in 2024 and 2025 at 2.2% each – however, the energy price shock resulting from the Middle East conflict temporarily pushed rates back up to 2.9% in early 2026.
The Bundesbank expects inflation to remain close to 3% for 2026 and 2027, only falling back below the 2 percent mark in 2028. In this continuously updated article, you will find current inflation figures for Germany, the US, the Eurozone, and other countries, the development over recent years, a simple explanation of how inflation occurs – and what you can do to protect your money from gradual devaluation.
How high is inflation in Germany currently?
The current inflation rate in Germany is 2.3% (June 2026). It is measured as the change in the Consumer Price Index (CPI) compared to the same month of the previous year. Core inflation – meaning inflation excluding volatile prices for energy and food – was slightly higher in June 2026 at 2.5%. The official figures are published by the Federal Statistical Office (Destatis) at the end of each month as a flash estimate and about two weeks later as a final result.
The first half of 2026 was shaped by an energy price shock: as a result of the war involving Iran and tensions in the Persian Gulf, oil and fuel prices rose significantly. In April 2026, energy prices were 10.1% above the previous year’s level, and overall inflation rose to 2.9%. Since the ceasefire, the situation has been easing again – energy inflation slowed to 3.4% in June, and the inflation rate fell for the second consecutive month.
| Month | Inflation Rate (CPI) | Core Inflation | Energy Prices vs. Previous Year |
|---|---|---|---|
| March 2026 | 2.7 % | approx. 2.5 % | sharply rising |
| April 2026 | 2.9 % | approx. 2.5 % | +10.1 % |
| May 2026 | 2.6 % | 2.6 % | +6.6 % |
| June 2026 | 2.3 % | 2.5 % | +3.4 % |
For context: The European Central Bank (ECB) aims for medium-term inflation of 2% in the euro area – this figure is considered price stability. Germany is currently only slightly above this target. Due to ongoing energy risks, the ECB nevertheless raised key interest rates by 0.25 percentage points in June 2026. Read more about the relationship between inflation and interest rates below.
Inflation in Germany: Development of the Last 10 Years
A look at inflation in Germany over the last 10 years shows two completely different phases: until 2020, inflation was mostly well below 2% – at times there was even talk of deflation risk. From 2021 onwards, the strongest price surge since German reunification followed, triggered by the aftermath of the COVID-19 pandemic (disrupted supply chains, pent-up demand) and massively exacerbated by the Russian attack on Ukraine and the resulting surge in energy prices.
| Year | Inflation Rate (Annual Average) | Note |
|---|---|---|
| 2015 | 0.5 % | Drop in oil prices suppresses inflation |
| 2016 | 0.5 % | Continued very low inflation |
| 2017 | 1.5 % | Normalization |
| 2018 | 1.8 % | Close to ECB target |
| 2019 | 1.4 % | |
| 2020 | 0.5 % | COVID year, temporary VAT reduction |
| 2021 | 3.1 % | Supply chain bottlenecks, catch-up effects |
| 2022 | 6.9 % | Energy crisis following Ukraine war, peak level |
| 2023 | 5.9 % | Slow easing, core inflation 5.1% |
| 2024 | 2.2 % | Significant easing |
| 2025 | 2.2 % | Stabilization, December at just 1.8% |
| 2026 | approx. 2.9 % (Forecast) | Energy price shock due to Middle East conflict |
Average Inflation Over the Last 10 and 20 Years
Average inflation in Germany over the last 10 years (2016 to 2025) stood at around 2.6% per year – significantly impacted by the outliers in 2022 and 2023. Looking at the last 20 years, the average comes out to around 2% per year.
That sounds harmless, but it adds up: adding together just the annual rates since 2020, consumer prices have risen by more than 20%. In other words: what cost 100 euros in 2020 costs over 120 euros today.
Review: The 2022/2023 Inflation Wave
The peak of the recent inflation wave was reached in autumn 2022, when monthly rates temporarily climbed above 8% (under the calculation basis at the time, even over 10%) – the highest levels in decades. The main drivers were natural gas, electricity, heating oil, and fuels, followed by food inflation, which temporarily exceeded 20% in 2023.
Only falling energy prices, ECB interest rate hikes, and weakening demand brought inflation back close to the 2 percent target from 2024 onwards. To understand the consequences such a phase can have on the economy, read our article on recession.
What is Inflation? Definition Simply Explained
Definition: What Does Inflation Mean?
Inflation means that the general price level rises over an extended period – goods and services become broadly more expensive. The flip side: with the same amount of money, you can buy less and less.
Inflation is therefore synonymous with currency devaluation or a loss of purchasing power. The term originates from the Latin “inflare” (to blow up or inflate) – referring to the expansion of the money supply relative to the available quantity of goods.
How is Inflation Measured? The Basket of Goods
Inflation is measured using the Consumer Price Index. For this purpose, the Federal Statistical Office uses a representative basket of goods containing around 700 types of items – from food, rent, and energy to haircut appointments and insurance policies.
Every month, the prices of these goods are collected and weighted: items households spend a lot on (such as housing) carry more weight than rare purchases. The percentage change in the index compared to the same month of the previous year is the inflation rate.
For European comparisons, there is also the Harmonised Index of Consumer Prices (HICP), reported by the Deutsche Bundesbank and Eurostat – the figures differ slightly from the national CPI due to methodological differences.
The fact that perceived inflation often feels higher than the official figure has a simple reason: prices of things you buy frequently – food, gas, coffee on the go – are perceived much more consciously than stable prices for electronics or clothing.
Anyone wishing to calculate their personal inflation rate can use the personal inflation calculator on the Federal Statistical Office’s website and enter their own expenditure shares there.
The Opposite of Inflation: Deflation
The opposite of inflation is deflation – a sustained decrease in the price level. While this initially sounds pleasant, economists consider it more dangerous than moderate inflation: if everything is cheaper tomorrow than today, consumers and businesses postpone purchases and investments. Demand collapses, companies cut prices and wages, and the economy enters a downward spiral. Japan struggled with this phenomenon for decades.
Two other terms that often come up in connection with inflation and deflation:
- Disinflation: Prices continue to rise, but at a slower pace – so the inflation rate decreases. This is precisely what was observed in Germany from 2023 to 2025 (falling from 5.9% to 2.2%).
- Stagflation: High inflation coincides with a stagnant or shrinking economy – a particularly uncomfortable combination that occurred, for example, in the 1970s following the oil crises.
How Does Inflation Occur? Causes and Types
Why does inflation happen in the first place? In practice, several causes usually interact. Economists primarily distinguish between the following mechanisms:
Demand-pull Inflation and Cost-push Inflation
- Demand-pull inflation: Demand exceeds supply – for instance, when households wanted to spend pent-up money after the COVID-19 pandemic, but production could not keep up yet. Suppliers can enforce higher prices.
- Cost-push / Supply-side inflation: Rising production costs (energy, raw materials, wages, transport) are passed on by companies to customers. The 2022 energy crisis is a textbook example.
- Monetary inflation: If the money supply grows significantly faster than economic output, money loses its value. The expansionary monetary policy of central banks following the financial and COVID crises is considered a factor in the recent wave of inflation.
Imported Inflation
Imported inflation occurs when price increases are “imported” into the domestic economy from abroad. Germany imports a large portion of its energy: if oil prices rise on global markets – as happened most recently in 2026 due to the conflict involving Iran – fuel, heating oil, and consequently transport costs and many products become more expensive domestically. A weak euro also drives inflation because imports priced in dollars become more expensive.
The Wage-Price Spiral
The so-called wage-price spiral is widely feared: rising prices lead to higher wage demands, higher wages increase company costs, companies in turn raise prices – and the cycle starts all over again. Central banks attempt to prevent precisely this entrenchment of inflation through timely rate hikes.
Types of Inflation: From Creeping to Galloping
Depending on the speed of currency devaluation, different types of inflation are distinguished:
- Creeping inflation (up to approx. 5% per year): the norm in developed economies, even desirable at around 2%.
- Trotting inflation (approx. 5% to 20%): confidence in the currency begins to suffer, savers lose noticeable purchasing power.
- Galloping inflation (above 20%): money devaluation becomes the dominant economic issue – currently observable, for instance, in Turkey and Argentina.
- Hyperinflation (over 50% per month): the monetary system effectively collapses.
The Hyperinflation of 1923
The most famous German example is the hyperinflation of 1923: to finance war debts and reparations, the Reich government ran the printing presses. By November 1923, one US dollar ultimately cost 4.2 trillion Marks, and a loaf of bread cost several hundred billion. Images of people carrying money in wheelbarrows to the bakery, and inflation banknotes with face values in the billions, remain a symbol of total currency collapse to this day.
Hyperinflation was only ended by monetary reform with the introduction of the Rentenmark. This experience continues to shape Germany’s stability culture – and the policies of the Bundesbank and later the ECB – to this day.
Calculating Inflation: Formula, Calculator, and Example Calculation
You can calculate the inflation rate from the change in the Consumer Price Index:
Inflation Rate = (Current CPI − Previous Year CPI) ÷ Previous Year CPI × 100
Example: If the index stands at 121.0 points and was at 118.3 points a year earlier, the result is (121.0 − 118.3) ÷ 118.3 × 100 ≈ 2.3% inflation. More exciting for your financial planning is the reverse calculation: What does inflation do to your savings long-term? The formula serves as a purchasing power inflation calculator: Purchasing Power = Amount ÷ (1 + Inflation Rate)Years.
| Purchasing Power of €10,000 | at 2% Inflation | at 3% Inflation | at 5% Inflation |
|---|---|---|---|
| after 5 years | €9,057 | €8,626 | €7,835 |
| after 10 years | €8,203 | €7,441 | €6,139 |
| after 20 years | €6,730 | €5,537 | €3,769 |
| after 30 years | €5,521 | €4,120 | €2,314 |
In other words: even at a “healthy” 2% inflation per year, uninvested savings lose almost half of their purchasing power over 30 years. At 5% – as seen on average in 2022/2023 – less than a quarter remains after 30 years. This is precisely why the question of the right inflation protection is so vital for savers and investors (more on this below).
Inflation in International Comparison: USA, Eurozone, Turkey & Co.
Inflation is a global phenomenon, but differences between countries are enormous. The following table shows the latest available inflation rates of key major economies:
| Country / Region | Inflation Rate | As of |
|---|---|---|
| Germany | 2.3 % | June 2026 |
| Eurozone | 2.8 % | June 2026 |
| EU Total | 2.9 % | June 2026 |
| USA | 3.5 % | June 2026 |
| China | 0.8 % | December 2025 |
| Turkey | approx. 31 % | March 2026 |
| Argentina | 31.6 % | December 2025 |
Current comparative data is published by, among others, Destatis (international price trends) and Eurostat.
Inflation in the USA
Inflation in the USA stood at 3.5% in June 2026 – after 4.2% in May, the first decline since January. Here too, energy was the main driver: following the ceasefire between the US and Iran, gasoline prices fell significantly, with the Consumer Price Index dropping 0.4% in June compared to the previous month – the sharpest monthly decline since 2020. The core rate stands at 2.6%.
The US Federal Reserve currently maintains its key interest rate in the range of 3.50% to 3.75%. Official US data can be found at the Bureau of Labor Statistics. Comparing the USA vs. Germany, US inflation reacted significantly more strongly to the oil price shock in 2026, but had also generally stayed slightly above German levels in prior years.
Inflation in the Eurozone and Europe
In the Eurozone, inflation fell to 2.8% in June 2026 (May: 3.2%). Across Europe, the spread is wide: while Sweden and the Czech Republic were recently around 1%, Romania recorded over 9%. Switzerland traditionally features Europe’s lowest inflation rates – partly thanks to the strong franc –, whereas Austria has mostly remained above German levels in recent years.
Inflation in Turkey
Inflation in Turkey represents an extreme case among major economies: in October 2022, it peaked at over 85% after the central bank, under political pressure, lowered interest rates despite rising prices and the Lira depreciated massively.
Since returning to orthodox monetary policy with high key rates, the rate is gradually falling – most recently to around 31% (March 2026), with an average just under 30% expected for full-year 2026. For the population, this continues to mean dramatic losses in purchasing power, especially as rent and food prices at times rose significantly faster than average.
Other Countries: Argentina, Russia, Japan
Argentina has struggled with high inflation for decades; after triple-digit rates in 2023/2024, inflation recently fell to around 30% – still high, but on a clear downward trend.
In Russia, war economy dynamics, sanctions, and labor shortages drive prices up; the central bank has kept key rates at very high levels for years.
Japan, on the other hand, represented the opposite problem for decades – deflation and zero interest rates – and has only experienced notable inflation rates again since 2022.
Inflation 2026 and 2027: The Current Forecast
What lies ahead? Deutsche Bundesbank significantly revised its inflation forecast for Germany upwards in June 2026 due to increased energy prices:
| Year | Expected Inflation (HICP, Bundesbank projection June 2026) |
|---|---|
| 2026 | 2.9 % |
| 2027 | 2.7 % |
| 2028 | 1.9 % |
Expected inflation for 2026 is thus clearly above the previous year – the 2 percent target is only expected to be reached again in 2028. Important context: inflation forecasts carry considerable uncertainty. As late as late 2025, most institutes projected rates around 2% for 2026; the energy price shock in spring overturned these expectations within just a few months.
Three factors are particularly critical for the 2026/2027 forecast: further oil price developments and the situation in the Persian Gulf, wage settlements (keyword: wage-price spiral amid persistently high service inflation), and ECB monetary policy.
Inflation and Interest Rates: The Role of the ECB
Inflation and interest rates are closely linked: the key interest rate is the central banks’ primary tool against inflation that is too high (or too low). When the ECB raises rates, loans become more expensive for businesses and consumers, and saving becomes more attractive. Demand for goods, real estate, and investments falls – easing price pressure. Conversely, rate cuts stimulate the economy, but can fuel inflation.
In practice, this recently meant: against the 2022/2023 inflation wave, the ECB raised key rates at record speed from 0% to over 4%. As price increases calmed down, interest rate cuts followed from 2024 onwards – until rising energy prices in 2026 forced the central bank to counter once again: in June 2026, it raised interest rates by 0.25 percentage points. For savers, the crucial metric is always the real interest rate – interest after deducting inflation.
Example: If your call money yields 2% interest with inflation at 2.9%, you lose around 0.9% real purchasing power per year – despite a nominally growing account balance. What rising interest rates mean for the real estate market is further explored in our article When will the real estate bubble burst?.
Consequences of Inflation: Who Wins, Who Loses?
The consequences of inflation are distributed very unevenly. Put simply: creditors and savers lose, while debtors and owners of tangible assets tend to benefit.
| Losers of Inflation | Profiteers of Inflation | |
|---|---|---|
| Who? | Savers with instant access accounts, cash, non-interest-bearing deposits; fixed income earners; creditors | Borrowers, heavily indebted states, owners of tangible assets (real estate, stocks) |
| Why? | Nominal balances and fixed payments lose real value | The real value of debt shrinks, while tangible assets and often rents rise with prices |
| Example | €100,000 in an account is worth only about €74,400 in real terms after 10 years at 3% inflation | A real estate loan of €100,000 “shrinks” in real terms by the same effect over the same period |
No Pay Raise Despite Inflation? The Real Wage Effect
For employees, the critical metric is real wage: if your salary grows slower than prices, you earn less in real terms – even without a pay cut. This happened to many employees in Germany in 2022/2023: real wages temporarily fell more sharply than they had in decades because wage increases lagged behind inflation.
Anyone who receives no salary increase despite inflation loses around 14% purchasing power in just five years at 3% inflation. A salary adjustment at least equal to the inflation rate is therefore a legitimate argument in any salary negotiation – many collective bargaining agreements now explicitly reference price trends.
Excursus: Lifestyle Inflation
Not to be confused with macroeconomic inflation is so-called lifestyle inflation: this refers to people automatically increasing their spending as their income rises – a larger apartment, a more expensive car, dining out more frequently.
The result resembles true inflation: despite a higher salary, no more money remains at the end of the month. Anyone aiming to build wealth should therefore direct income increases at least partially into capital investments rather than consumption.
Protection Against Inflation: How Do I Protect My Money?
The most important rule for protecting against inflation is: do not hold more money than necessary in nominal assets (cash, instant access savings, non-interest accounts), but invest long-term in real assets and productive investments. A detailed overview listing the pros and cons of all asset classes can be found in our post on inflation-proof investments. The main options at a glance:
- Real Estate: The classic tangible asset. Property prices and rents tend to rise with inflation in the long term, while inflation reduces the real burden of existing financing. We explain how this dual effect works in detail under Real Estate and Inflation.
- Stocks and ETFs: Stocks during inflation? Long-term yes – companies can pass on rising costs through higher prices, and productive assets grow in real terms. In the short term, however, stock markets often suffer under rate hikes that accompany high inflation.
- Inflation-indexed Bonds: For these securities (e.g., inflation-linked federal bonds), interest and principal repayments are tied to the consumer price index – direct, but low-yielding inflation protection.
- Gold and Commodities: Gold is viewed as a crisis currency and has preserved purchasing power over very long periods, but yields no ongoing returns and fluctuates heavily.
- Call Money and Fixed Deposits: Only useful for liquidity reserves. If interest rates remain below the inflation rate, real interest is negative – guaranteeing a loss of purchasing power.
Comparison calculation: Assuming inflation averages 2.5% per year, €50,000 in a non-interest-bearing account will have a purchasing power of only around €34,500 after 15 years. The same €50,000, invested as equity in a rental property with a 4% total yield, grows nominally to around €90,000 – in real terms (adjusted for inflation), this still corresponds to roughly €62,000 in today’s purchasing power. The difference between “leaving money idle” and “investing” is almost double in this example.
Find more fundamentals and current analyses on real estate as an investment at meine-renditeimmobilie.de as well as in our article overview on the topic of inflation.
Frequently Asked Questions About Inflation
What is inflation – in one sentence?
Inflation is the sustained increase in the general price level, causing money to lose purchasing power – simply explained: for the same euro, you get less tomorrow than today.
How high is inflation in Germany currently?
Currently 2.3% (June 2026, CPI compared to same month last year). The latest figure is published by the Federal Statistical Office at the end of each month.
How high was inflation in 2024 and 2025?
Inflation in Germany averaged 2.2% in both 2024 and 2025. In December 2025, the monthly rate even dropped to 1.8% – before the early 2026 energy price increase pushed inflation back up.
What is the opposite of inflation?
The opposite of inflation is called deflation – a sustained decrease in price levels that can paralyze consumption and investment, which central banks fight just as aggressively as excessively high inflation.
Why is 2% inflation the goal – and not 0%?
Slight inflation serves as economic lubricant: it maintains a safety margin from dangerous deflation, facilitates wage and price adjustments, and gives monetary policy room to maneuver. That is why the ECB and most major central banks define price stability as 2% inflation – not 0%.
Is inflation good for property owners?
Generally yes: asset value and rental income tend to rise with price levels long-term, while existing debt is devalued in real terms. However, location, financing structure, and interest rate environment matter – details in our article Real Estate and Inflation.