Mobile Menu Icon

Which Stocks to Buy: 40+ High-Return Stocks with Return Triangles

We have created return triangles with dividends included for over 40 high-return stocks so that you can see the history of returns for yourself. In previous articles, we have already presented our very simple strategy along with other tips around stock purchasing.

With 22 tech stocks out of 55 companies, our selection is tech-heavy. We expect the AI boom to make the next two decades even more of a technology age than the last two decades with the internet and smartphones.

Note: This article does not constitute an investment recommendation. Decide at your own risk whether and which stocks to buy.

Transparency: Several Meine-Renditeimmobilie employees involved in this article have some of the listed stocks in their private portfolios.

Notes on Stock Prices

  1. Stock prices are as of December 1 (mostly) or December 31 (a few) of each year. Dividends and stock splits are included.
  2. The most recent development (Dec 2023 to today) is not considered in the return triangles. This should not be decisive in such a long-term view.
  3. Almost all prices are original prices in US dollars on the NYSE or Nasdaq, instead of euros on German exchanges, as the historical data often doesn’t go back as far on German exchanges. Except for a few European stocks for which we had longer history in euros.
  4. No guarantee of accuracy in information or calculations. These return triangles provide an overview; miscalculations or poor data foundations are possible.

Legend

214.78 Total return price (mostly) in US dollars; where specified, in euros. These values are back-calculated to include stock splits and dividend payments. Therefore, old prices are accurate in relation to the most recent price but incorrect as absolute figures.
-12.3 Loss of -10.1% and below
-7.1 Loss of -10.0% to -0.1%
1.6 Return of 0 to 2.9%
8.7 Return of 3 to 9.9%
16.4 Return of 10.0% to 19.9%
25.5 Return of 20.0% to 29.9%
34.9 Return of 30.0% to 39.9%
42.2 Return of 40.0% and above

Reading the Return Triangle

The most interesting part is the last horizontal row with “2023” in the first column. It shows the average annual total return (price appreciation plus dividends) if you held this stock from December in the year XXXX until December 2023.

To find the corresponding purchase year, go vertically up from the 2023 row until you reach the “step” and then horizontally to the left to the first gray column with the years.

The “steps” on the right edge of the return triangle represent the return for each year. The corresponding year can be found in the first column to the far left in the same row as the step.

Using the same system, you can also view any other time periods.

Our “Magnificent 14”

Our 14 favorite stocks as of October 2024.

P.S.: The actual so-called “Magnificent 7” are Apple, Microsoft, Amazon, Alphabet, Meta, Tesla, and Nvidia.

Resilient High Performers

Stocks that rose against the trend during 2022 (specifically, between 12/01/2021 and 12/01/2022) while most stocks saw significant declines.

Rheinmetall may not be as representative here due to the special effect of the Ukraine war. Eli Lilly’s “wonder drug” Mounjaro was approved in 2022, but its weight-loss application was only added in 2023, so this resilience against the downtrend could be deserved rather than a special effect.

The high value for Rheinmetall should be viewed with caution due to the special effect of the Ukraine war
12/01/2021 to 12/01/2022
Rheinmetall+139.1%
McKesson+51.8%
FICO+38.0% (but -15.1% in 2021)
Eli Lilly+34.3%
Deere & Company+26.6%
Quanta Services+24.6%
Munich Re+23.7%
Novo Nordisk+22.6%
Christian Dior+18.4%
Arthur J. Gallagher+12.5%
United Rentals+7.0%
UnitedHealth+7.0%
Cintas+3.0%

As expected, this table does not include high-tech stocks. Investors tend to lose faith in such stocks quickly during crises. The “Magnificent 7,” including Nvidia, are completely absent here as well.

High-return, non-tech stocks are therefore a good option to balance the volatility of tech stocks without significantly reducing the return potential.

Alphabet (Google)

Internet services, $307 billion in revenue, 182,000 employees

Dominant and seemingly unassailable in internet search. Advertising, based on internet search, is still the main revenue source. The two founders have already stepped down from management. They frequently explore other business fields, with modest success.
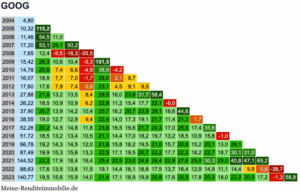
GOOG

GOOG over 19 years - from Dec 2004 until Dec 2023.

20044,80
200510,32115,2
200611,4654,511,0
200717,2053,129,150,2
20087,6512,4-9,5-18,3-55,5
200915,4226,310,610,4-5,3101,5
201014,7820,67,46,6-4,938,9-4,2
201116,0718,97,77,0-1,728,02,18,7
201217,6017,67,97,40,523,14,59,19,5
201327,8821,613,213,58,429,516,023,631,758,4
201426,2218,510,910,96,222,811,215,417,722,1-6,0
201537,9020,713,914,210,425,716,220,723,929,116,644,6
201638,5519,012,712,99,422,414,017,319,121,711,421,31,7
201752,2620,214,514,811,823,816,519,821,724,317,025,917,435,6
201851,7218,513,213,410,521,114,417,018,219,713,218,510,915,8-1,0
201966,7819,214,314,512,021,815,818,219,521,015,720,615,220,113,029,1
202087,4919,915,315,613,322,517,119,520,722,217,722,218,222,718,730,131,0
2021144,5222,217,918,416,425,420,523,024,626,422,827,625,030,329,040,847,165,2
202288,6317,613,513,611,519,114,416,116,817,513,716,412,914,911,114,49,90,6-38,7
2023140,7719,515,615,914,021,417,118,919,820,817,620,517,820,318,022,220,517,2-1,358,8

Amazon

Retail, Cloud Computing, $575 billion in revenue, 1.5 million employees

Early on, Amazon built a second, very lucrative and successful division with AWS (“Amazon Web Services”). This will likely prove helpful with the rise of Temu. We choose Amazon over Pinduoduo (Temu).
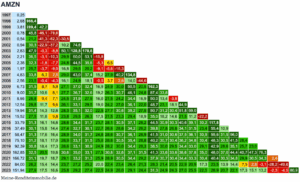
AMZN

AMZN over 26 years - from Dec 1997 until Dec 2023.

19970,25
19982,68966,4
19993,81289,442,2
20000,7845,8-46,1-79,6
20010,5421,2-41,3-62,3-30,5
20020,9430,3-22,9-37,210,274,6
20032,6347,9-0,3-8,850,1120,5178,6
20042,2136,5-3,1-10,329,960,053,1-15,8
20052,3632,3-1,8-7,724,844,535,6-5,36,5
20061,9725,7-3,7-9,016,829,520,2-9,1-5,6-16,3
20074,6333,86,32,529,043,037,415,227,940,2134,8
20082,5623,5-0,4-4,316,124,918,1-0,53,72,814,0-44,6
20096,7331,58,75,927,137,032,416,924,930,050,520,5162,3
20109,0031,710,68,127,736,732,619,226,330,746,124,887,433,8
20118,6628,89,47,124,531,927,916,021,524,234,416,950,013,4-3,8
201212,5429,811,79,626,133,129,519,024,227,036,122,048,723,118,144,9
201319,9431,414,312,628,335,132,022,527,730,639,227,550,731,230,451,859,0
201415,5227,511,69,823,829,526,317,521,523,329,418,935,018,214,621,511,2-22,2
201533,7931,316,114,628,634,431,723,728,130,537,128,244,530,930,340,639,130,2117,8
201637,4930,115,814,427,432,730,122,726,628,634,226,239,827,826,834,131,523,455,410,9
201758,4731,317,616,428,934,031,724,828,630,736,128,941,531,030,637,536,130,955,631,556,0
201875,1031,218,117,028,933,731,525,028,630,535,428,840,230,730,436,234,830,448,330,541,528,4
201992,3930,818,417,328,633,130,924,928,230,034,428,338,530,029,534,433,029,142,928,635,125,723,0
2020162,8532,520,519,630,635,033,127,530,832,637,131,541,333,633,638,637,835,048,037,044,440,747,376,3
2021166,7231,119,718,729,133,231,325,928,930,534,429,237,930,730,434,433,330,440,430,534,829,930,534,32,4
202284,0026,215,414,423,727,225,220,022,423,426,421,328,321,420,522,920,917,323,513,914,47,52,8-3,1-28,2-49,6
2023151,9427,917,516,625,829,227,422,524,926,029,124,431,324,924,327,025,522,528,920,722,117,315,113,2-2,3-4,580,9

AMD ⭐

Semiconductors, $23 billion in revenue, 26,000 employees

The Ryzen and Epyc processors are well-regarded in desktop computers and servers. AMD is thriving, and Intel is struggling. The days of being a perennial second behind Intel seem to be over. In graphics cards, AMD has long been a budget alternative to Nvidia.
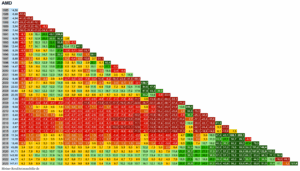
AMD

AMD over 38 years - from Dec 1985 until Dec 2023.

198514,50
19866,88-52,6
19874,94-41,6-28,2
19884,31-33,2-20,8-12,7
19893,94-27,8-17,0-10,7-8,7
19902,44-30,0-22,8-21,0-24,8-38,1
19918,75-8,14,915,426,649,1259,0
19929,06-6,54,712,920,432,092,83,6
19938,88-6,03,710,315,522,553,80,7-2,1
199412,44-1,77,714,119,325,950,312,417,240,1
19958,25-5,52,06,69,713,127,6-1,5-3,1-3,6-33,7
199612,88-1,16,511,214,718,432,08,09,213,21,756,1
19978,88-4,02,36,08,310,720,30,2-0,40,0-10,63,7-31,1
199814,500,06,410,312,915,625,07,58,110,33,920,76,163,4
199914,470,05,99,411,613,921,96,56,98,53,115,14,027,7-0,2
200013,81-0,35,18,210,212,118,95,25,46,51,810,91,815,9-2,4-4,5
200115,860,65,78,710,512,318,66,16,47,53,511,54,315,63,04,714,8
20026,46-4,6-0,41,82,93,98,5-2,7-3,3-3,5-7,9-3,4-10,9-6,2-18,3-23,6-31,6-59,3
200314,900,24,77,18,610,014,94,54,65,32,07,72,19,00,50,72,6-3,1130,7
200422,022,26,79,210,712,217,07,47,78,65,911,56,913,97,28,812,411,684,647,8
200530,603,88,210,712,213,718,49,49,810,98,514,010,116,711,313,317,217,967,943,339,0
200620,351,65,67,79,010,114,25,85,96,64,28,64,79,74,35,06,75,133,210,9-3,9-33,5
20077,50-3,00,42,13,03,66,8-1,0-1,3-1,2-3,8-0,8-4,8-1,7-7,1-7,9-8,4-11,73,0-15,8-30,2-50,5-63,1
20082,16-7,9-5,1-3,9-3,4-3,1-0,7-7,9-8,6-9,0-11,8-9,8-13,8-12,1-17,3-19,0-20,7-24,8-16,7-32,0-44,0-58,7-67,4-71,2
20099,68-1,71,53,13,94,67,50,60,40,5-1,71,1-2,20,7-3,6-3,9-3,9-6,05,9-6,9-15,2-25,0-21,913,6348,1
20108,18-2,30,72,23,03,56,2-0,4-0,6-0,5-2,6-0,1-3,2-0,6-4,7-5,1-5,1-7,13,0-8,2-15,2-23,2-20,42,994,6-15,5
20115,40-3,7-1,00,41,01,43,9-2,4-2,7-2,7-4,8-2,6-5,6-3,5-7,3-7,9-8,2-10,2-2,0-11,9-18,2-25,1-23,3-7,935,7-25,3-34,0
20122,40-6,4-4,0-2,8-2,4-2,1-0,1-6,0-6,4-6,7-8,7-7,0-10,0-8,3-12,1-12,9-13,6-15,8-9,4-18,4-24,2-30,5-30,0-20,42,7-37,2-45,8-55,6
20133,87-4,6-2,1-0,9-0,4-0,12,0-3,6-4,0-4,1-6,0-4,1-6,8-5,1-8,4-9,0-9,3-11,1-4,6-12,6-17,6-22,8-21,1-10,412,4-20,5-22,1-15,361,3
20142,67-5,7-3,3-2,3-1,8-1,50,4-5,0-5,4-5,6-7,4-5,8-8,4-6,8-10,0-10,7-11,1-12,8-7,1-14,5-19,0-23,7-22,4-13,73,6-22,7-24,4-20,95,5-31,0
20152,87-5,3-3,0-1,9-1,5-1,20,7-4,5-4,9-5,0-6,7-5,1-7,6-6,1-9,1-9,6-9,9-11,5-6,1-12,8-16,9-21,1-19,6-11,34,1-18,3-18,9-14,66,1-13,97,5
201611,34-0,81,72,93,54,06,11,00,91,1-0,41,5-0,61,3-1,4-1,4-1,2-2,24,1-2,1-5,4-8,6-5,74,723,02,35,616,047,443,1106,1295,1
201710,28-1,11,32,53,03,55,50,60,50,6-0,81,0-1,10,7-1,8-1,9-1,7-2,73,1-2,6-5,7-8,7-6,03,218,90,83,311,333,827,756,789,3-9,3
201818,460,73,14,35,05,57,52,82,83,01,73,61,73,51,21,31,60,96,81,4-1,3-3,8-0,88,523,97,410,719,240,536,762,286,027,679,6
201945,863,45,97,27,98,510,66,16,26,55,47,45,77,85,65,96,56,112,27,35,02,96,416,332,016,821,130,752,451,076,699,959,3111,2148,4
202091,715,47,99,310,010,712,98,48,69,08,010,18,510,78,79,29,99,715,911,39,37,611,421,236,722,727,337,057,757,280,399,968,6107,4122,9100,0
2021143,906,69,110,411,211,914,19,810,010,59,511,610,112,310,511,011,811,717,713,411,710,213,923,538,125,229,838,957,657,176,892,066,293,498,377,156,9
202264,774,16,47,68,38,910,86,76,87,16,17,96,48,36,46,77,36,912,28,06,24,57,515,527,515,718,825,339,036,849,056,133,744,536,912,2-16,0-55,0
2023147,416,38,69,910,611,213,29,29,49,88,910,89,411,49,710,210,810,716,112,110,59,112,420,532,521,524,931,745,443,956,263,644,355,951,533,917,11,2127,6

Apple

Hardware, Software, Online Retail, $383 billion in revenue, 161,000 employees

Strong brand, pricing power, high price point. Controls the entire ecosystem (software, hardware, app store). Successfully transitioned from founder-led to professional management.
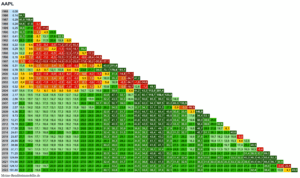
AAPL

AAPL over 38 years - from Dec 1985 until Dec 2023.

19850,08
19860,1484,1
19870,2995,9108,4
19880,2854,841,9-3,4
19890,2534,621,2-7,5-11,6
19900,3132,321,81,84,523,5
19910,4132,323,88,713,127,832,3
19920,4328,320,88,411,520,418,96,9
19930,2213,96,4-4,9-5,2-3,5-11,2-27,2-50,4
19940,2916,19,60,00,63,2-1,3-10,5-18,135,2
19950,2412,26,2-2,3-2,2-0,5-4,8-12,3-17,95,7-17,3
19960,166,91,2-6,6-7,0-6,3-10,5-17,3-22,4-9,9-26,4-34,5
19970,102,3-3,1-10,2-10,9-10,9-14,9-21,0-25,6-17,6-30,2-35,8-37,1
19980,3111,46,80,61,02,40,1-3,8-5,57,51,58,740,0211,9
19990,7818,114,18,59,712,110,98,48,623,821,734,070,1179,9151,1
20000,227,53,5-2,0-1,9-0,9-3,1-6,4-7,90,6-4,2-1,49,331,4-14,8-71,1
20010,339,65,90,91,32,40,7-2,0-3,05,51,85,416,035,22,3-34,747,2
20020,226,42,8-2,0-1,9-1,1-2,9-5,6-6,70,1-3,6-1,55,416,9-8,5-34,7-1,8-34,6
20030,328,45,10,60,91,90,4-1,9-2,74,11,23,710,821,70,9-19,712,8-1,249,1
20040,9714,411,47,48,19,58,66,96,914,712,816,825,538,621,14,644,243,3112,0201,4
20052,1718,315,511,812,814,513,912,713,221,220,024,633,847,132,118,757,460,1115,7159,4123,3
20062,5618,315,712,113,114,714,213,113,521,019,924,032,243,530,318,650,050,685,599,562,318,0
20075,9722,019,616,317,519,319,118,319,126,826,230,739,250,739,029,159,862,094,2107,583,266,0133,5
20082,5716,614,210,911,713,112,511,511,818,016,920,026,234,523,614,335,734,151,151,527,65,90,3-56,9
20096,3620,318,115,116,017,617,316,517,123,622,826,432,941,531,723,445,044,762,164,445,630,835,43,1146,9
20109,7321,419,416,517,519,118,918,218,925,124,528,034,342,333,325,945,845,660,962,746,835,039,617,694,453,1
201112,2121,619,616,917,819,419,218,619,225,224,627,833,741,132,725,843,843,556,657,543,633,436,719,668,038,625,6
201216,1922,020,117,418,419,919,819,219,825,525,028,133,640,532,726,342,842,554,054,542,233,336,022,158,436,629,032,6
201317,5021,519,617,118,019,419,218,719,324,624,126,931,938,230,924,939,839,249,149,137,929,831,619,646,728,821,619,78,1
201424,6122,120,317,918,820,220,019,520,125,324,827,632,438,331,525,939,939,348,448,338,231,032,722,445,731,126,126,323,340,6
201523,8721,119,417,117,919,219,018,519,023,923,425,830,335,629,123,936,535,843,643,233,827,128,218,937,524,719,718,213,816,8-3,0
201626,8520,919,216,917,718,918,818,318,823,422,825,229,334,328,223,234,934,141,140,531,925,726,518,234,122,918,417,113,515,34,412,5
201739,8621,620,017,818,619,919,819,319,824,323,926,230,235,029,224,535,634,941,641,133,127,528,420,935,625,822,321,819,722,817,429,248,5
201837,7120,719,117,017,718,918,718,318,723,022,524,628,332,727,222,732,932,138,137,429,924,625,118,230,821,918,517,515,116,611,316,518,5-5,4
201971,2522,320,818,819,620,820,720,320,825,024,626,830,534,929,625,435,434,840,640,133,228,329,222,935,227,324,824,723,626,423,731,438,533,789,0
2020129,8923,722,320,321,122,422,322,022,626,826,528,632,336,631,627,637,437,042,742,335,831,432,426,738,631,629,630,029,733,232,040,348,348,385,682,3
2021174,9024,022,620,721,522,722,722,423,027,026,728,832,436,631,727,937,336,842,341,935,731,632,527,338,331,830,030,530,333,332,339,445,544,766,856,734,6
2022128,7222,320,919,019,720,920,820,420,924,724,326,229,433,228,624,933,532,937,637,131,227,227,722,732,226,024,023,923,024,823,027,229,926,435,921,8-0,5-26,4
2023191,8022,921,619,820,521,621,521,221,725,425,127,030,133,829,325,834,133,538,237,632,128,328,924,233,327,625,825,825,227,125,629,832,429,938,428,113,94,749,0

Applied Materials

Equipment for Semiconductors, $26 billion in revenue, 33,000 employees

Applied Materials includes parts of the Leybold company, founded by Ernst Leybold, a German vacuum technology pioneer in the 19th century. In Germany, there are still many research and development activities at five locations. Competitors include Lam Research and KLA Corporation, which are also on this list.
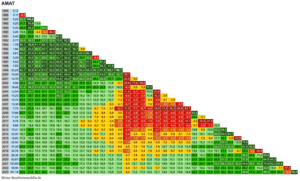
AMAT

AMAT over 38 years - from Dec 1985 until Dec 2023.

19850,12
19860,11-8,3
19870,2235,4100,0
19880,2527,750,813,6
19890,3328,844,222,532,0
19900,2515,822,84,40,0-24,2
19910,4022,229,516,117,010,160,0
19920,7730,438,328,532,532,675,592,5
19931,7840,148,841,748,152,492,4111,0131,2
19941,9436,243,236,540,742,566,969,358,79,0
19953,6140,647,441,946,449,070,673,367,442,486,1
19963,2935,140,535,138,038,953,752,443,822,730,2-8,9
19975,5237,642,838,041,042,255,654,948,332,741,723,767,8
19987,8337,942,738,441,142,253,852,947,234,541,729,454,341,8
199923,2345,750,947,451,053,065,566,162,753,464,359,391,8105,1196,7
200014,0037,341,437,639,940,649,648,443,734,339,031,143,636,433,7-39,7
200114,7035,138,635,036,837,244,843,438,830,233,626,434,927,723,4-20,55,0
20029,5629,432,228,629,729,635,533,428,620,522,114,919,511,65,1-25,6-17,4-35,0
200316,4631,434,331,032,232,238,036,332,124,926,820,925,920,016,0-8,35,55,872,2
200412,5427,730,126,827,727,432,330,326,219,420,514,818,212,48,2-11,6-2,7-5,214,5-23,8
200513,2326,528,725,626,325,930,328,424,518,219,113,916,711,57,8-9,0-1,1-2,611,4-10,35,5
200613,7425,327,324,324,924,528,526,622,917,017,712,915,410,77,3-7,2-0,3-1,39,5-5,84,73,9
200713,3923,925,722,823,322,826,424,521,015,516,011,513,69,36,1-6,7-0,6-1,57,0-5,02,20,6-2,5
20087,7519,921,318,518,718,121,019,015,510,310,46,17,43,1-0,1-11,5-7,1-8,7-3,4-14,0-11,3-16,3-24,9-42,1
200910,8820,722,119,419,719,122,020,116,912,012,28,29,65,83,0-7,3-2,8-3,71,9-6,7-2,8-4,8-7,5-9,940,4
201011,2219,921,318,618,918,320,919,216,011,411,67,99,25,63,0-6,4-2,2-3,02,0-5,3-1,8-3,2-4,9-5,720,33,1
20118,7617,919,116,616,716,118,516,713,79,39,35,76,73,40,9-7,8-4,2-5,0-1,0-7,6-5,0-6,6-8,6-10,14,2-10,3-21,9
20129,6617,618,816,316,415,818,116,413,59,39,36,07,03,81,5-6,5-3,0-3,70,1-5,7-3,2-4,4-5,7-6,35,7-3,9-7,210,3
201315,3118,920,117,717,917,319,618,015,311,411,58,49,56,64,6-2,90,70,34,4-0,72,21,81,62,314,68,910,932,258,5
201422,0019,720,818,618,818,320,519,016,512,712,910,011,18,56,7-0,43,33,27,22,75,85,86,17,419,015,118,335,950,943,7
201516,8317,918,916,816,916,318,316,914,410,810,88,09,06,44,6-2,01,21,04,40,22,72,42,32,911,77,58,417,720,34,8-23,5
201629,5619,420,518,418,618,120,118,816,413,013,210,511,69,27,71,44,84,88,44,67,47,68,09,218,215,317,527,532,324,515,975,6
201747,2620,521,619,619,819,421,420,117,914,614,912,413,511,39,94,07,47,611,27,810,711,211,913,422,220,222,832,437,432,529,067,659,9
201830,7618,319,217,317,416,918,817,415,212,112,29,810,78,57,11,54,54,47,64,36,66,76,97,914,812,213,419,721,315,08,722,32,0-34,9
201958,3920,020,919,119,218,820,719,517,414,414,612,313,311,310,04,77,88,011,28,210,811,211,813,120,218,320,126,829,325,021,636,525,511,289,8
202083,6720,621,519,719,919,621,420,218,215,315,613,414,412,511,46,39,49,612,810,012,613,113,815,121,920,422,328,531,027,524,937,829,721,064,943,3
2021153,6522,023,021,221,521,223,021,920,017,317,615,516,614,913,89,012,112,515,713,215,916,617,519,025,824,726,933,236,033,432,044,639,034,370,962,283,6
202295,9619,820,719,019,118,820,419,317,514,715,012,913,912,111,06,49,19,312,29,712,012,412,914,019,718,219,624,325,822,620,228,221,715,232,918,07,1-37,5
2023161,1920,921,820,120,320,021,720,618,816,216,514,515,513,912,98,411,211,514,412,114,414,915,616,822,421,222,827,529,226,524,832,627,422,739,328,924,42,468,0

Arista Networks ⭐

Networking Technology, $5.8 billion in revenue, 4,000 employees

Routers and switches for data centers. German co-founder of Sun Microsystems, Andy Bechtolsheim, is one of the Arista founders and holds 15 percent. Bechtolsheim was accused of insider trading (related to another company) by the SEC. In early 2024, he agreed to pay around $1 million in fines and is prohibited from serving as CEO or on the board of a publicly traded company for five years.
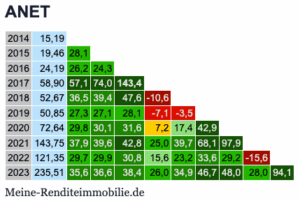
ANET

ANET over 9 years - from Dec 2014 until Dec 2023.

201415,19
201519,4628,1
201624,1926,224,3
201758,9057,174,0143,4
201852,6736,539,447,6-10,6
201950,8527,327,128,1-7,1-3,5
202072,6429,830,131,67,217,442,9
2021143,7537,939,642,825,039,768,197,9
2022121,3529,729,930,815,623,233,629,2-15,6
2023235,5135,636,638,426,034,946,748,028,094,1

ARM ⭐

Microprocessors, $2.7 billion in revenue, 6,000 employees

ARM is an alternative, energy-efficient microprocessor architecture. ARM does not manufacture but licenses its designs. ARM processors are found in iPhones and many Android devices.

The British company has been publicly listed only since 2023, so we could not create a return triangle for it.

The share price of ARM (ticker symbol ARM) rose from about 50 to 150 US dollars from October 2023 to September 2024, an increase of 200% in one (its first) year.

According to our strategy of selecting based on a strong, long-term history of returns, ARM would be excluded due to lack of history. We still include ARM here because of its exceptional position in the processor market.

Arthur J. Gallagher & Co.

Insurance Broker, $10 billion in revenue, 52,000 employees

AJG is the world’s fourth-largest and globally active insurance broker.
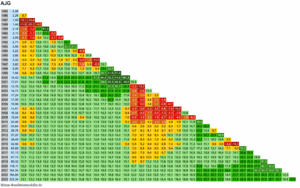
AJG

AJG over 38 years - from Dec 1985 until Dec 2023.

19852,08
19862,268,7
19871,50-15,1-33,6
19881,44-11,5-20,2-4,0
19892,181,2-1,220,651,4
19902,110,3-1,712,021,0-3,2
19912,090,1-1,68,613,2-2,1-0,9
19922,713,93,112,617,17,513,329,7
19933,556,96,715,419,813,018,930,331,0
19943,225,04,511,514,48,111,115,59,0-9,3
19953,866,46,112,515,110,012,816,612,54,319,9
19963,324,33,99,211,06,27,89,75,2-2,21,5-14,0
19973,825,24,99,811,47,38,810,67,11,85,9-0,515,1
19985,067,16,911,713,49,811,613,511,07,312,09,423,532,5
19997,669,89,814,616,413,415,417,616,013,718,918,732,141,651,4
200015,4214,314,719,621,819,522,024,924,323,329,831,946,859,274,6101,3
200117,0114,014,418,920,918,720,923,322,621,626,828,038,645,349,849,010,3
200214,7612,212,416,518,115,817,619,418,517,221,021,128,231,030,724,4-2,2-13,2
200316,7312,312,516,317,815,717,318,918,016,820,120,126,027,927,021,62,8-0,813,3
200417,2411,811,915,416,814,816,217,616,715,418,318,122,924,022,717,62,80,48,13,0
200517,0011,111,214,415,613,714,916,215,213,916,316,019,920,518,914,22,00,04,80,8-1,4
200616,9810,510,613,614,712,813,915,014,012,814,914,417,718,016,312,01,60,03,60,5-0,8-0,1
200714,519,29,312,012,911,112,012,911,810,612,311,714,314,312,48,3-0,9-2,6-0,3-3,5-5,6-7,6-14,5
200816,349,49,412,012,911,212,012,911,910,712,311,714,214,112,48,80,7-0,61,7-0,5-1,3-1,3-1,912,6
200915,048,68,611,011,810,110,911,610,69,410,810,212,312,110,47,0-0,3-1,50,3-1,8-2,7-3,0-4,01,8-8,0
201020,469,69,612,012,811,312,012,811,910,912,311,813,913,812,39,32,92,14,22,92,93,84,812,111,936,0
201124,6410,010,012,413,111,712,413,112,311,412,712,314,314,212,910,24,43,85,95,05,26,47,714,214,728,020,4
201226,789,910,012,213,011,512,212,912,111,212,512,113,913,912,610,14,74,26,15,45,76,77,913,013,121,214,48,7
201337,2010,810,913,113,912,513,314,013,312,513,713,415,315,314,211,97,06,78,88,38,910,311,917,017,925,422,122,938,9
201438,4910,610,712,813,512,212,913,512,812,013,212,914,614,613,511,46,86,58,37,98,49,510,815,015,320,717,116,019,93,5
201534,569,89,911,912,511,211,812,411,710,912,011,613,113,012,09,95,55,26,86,26,57,48,211,511,314,911,18,88,9-3,6-10,2
201645,6910,510,512,513,111,912,613,112,511,712,812,514,014,013,011,17,06,88,48,08,59,410,413,613,717,214,313,114,37,19,032,2
201757,1310,911,012,913,512,413,013,613,012,313,313,014,514,513,611,88,07,99,49,29,710,611,714,714,918,215,815,016,411,314,128,625,0
201867,7311,111,213,113,712,613,213,713,212,513,513,314,714,713,812,28,68,510,09,810,311,212,215,015,318,216,115,516,712,715,225,121,818,6
201989,3211,711,813,614,213,213,814,413,813,214,214,015,415,414,613,19,79,711,211,011,612,613,616,416,719,517,817,518,815,718,326,825,025,031,9
2020118,1112,212,314,114,813,714,414,914,413,914,914,716,016,115,413,910,710,712,212,212,813,814,917,517,920,619,219,020,417,920,527,926,827,432,132,2
2021164,3412,913,014,815,414,515,115,715,214,715,715,516,917,016,315,011,912,013,513,514,215,216,318,919,422,120,920,922,320,423,029,729,230,234,435,639,1
2022184,8512,913,014,715,314,415,015,615,114,615,615,416,716,816,214,812,012,013,513,514,115,116,118,518,921,320,120,121,319,521,727,126,226,528,527,425,112,5
2023223,3413,113,214,915,514,615,215,715,314,815,715,616,916,916,415,112,312,413,813,814,415,416,418,619,021,320,220,221,319,621,626,325,425,527,025,723,716,620,8

ASML

Lithography for Semiconductors, $28 billion in revenue, 42,000 employees

ASML, based in the Netherlands and one of the few European companies on this list, is as dominant in lithography systems for the semiconductor industry as Google is in internet search.
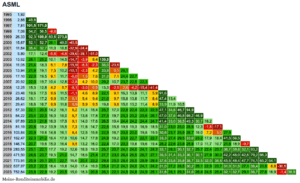
ASML

ASML over 28 years - from Dec 1995 until Dec 2023.

19951,92
19962,8849,8
19977,81101,5171,0
19987,0654,256,5-9,6
199926,3392,3109,083,6273,0
200015,6752,152,726,149,0-40,5
200111,8435,432,711,018,8-32,9-24,4
20025,8017,112,4-5,8-4,8-39,6-39,1-51,0
200313,9228,125,210,114,5-14,7-3,98,4139,8
200411,0521,418,35,17,8-15,9-8,3-2,338,0-20,6
200513,9421,919,17,510,2-10,1-2,34,233,90,126,1
200617,1022,019,59,111,7-6,01,57,631,07,124,422,7
200720,9222,019,710,412,8-2,84,210,029,210,723,722,522,3
200812,2515,312,84,25,7-8,1-3,00,513,3-2,52,6-4,2-15,4-41,4
200923,4819,617,59,611,5-1,14,68,922,19,116,313,911,15,991,6
201026,6219,117,29,911,70,15,49,421,09,715,813,811,78,447,413,4
201129,4118,616,79,911,60,95,99,519,89,815,013,211,48,933,911,910,5
201257,3322,120,514,216,16,211,415,425,717,022,822,422,322,347,134,646,794,9
201384,2223,422,016,018,08,713,817,827,519,725,325,225,626,147,037,646,869,246,9
201497,8923,021,616,017,99,114,017,626,519,424,424,224,424,741,433,038,549,330,716,2
201581,1920,619,213,915,57,311,614,722,515,819,919,318,918,531,023,025,028,912,3-1,8-17,1
2016103,8420,919,614,616,18,412,515,622,916,720,520,019,819,530,623,725,528,716,07,23,027,9
2017162,4722,321,216,417,910,614,717,824,919,223,022,722,722,733,327,429,533,023,217,918,441,556,5
2018146,7420,719,615,016,49,513,216,022,417,020,319,819,619,428,222,623,825,817,011,710,721,818,9-9,7
2019283,5523,122,117,719,212,616,519,325,720,724,124,024,124,333,128,330,132,725,722,423,736,739,832,193,2
2020471,5024,623,719,521,014,718,621,427,723,026,426,526,727,135,531,433,336,130,127,930,042,246,042,679,266,3
2021773,9125,925,121,122,716,620,423,229,425,028,428,528,929,437,633,835,838,733,532,034,445,649,447,774,165,264,1
2022537,9723,222,318,419,814,017,419,925,421,224,124,024,124,231,027,228,530,225,122,923,731,031,527,138,423,86,8-30,5
2023752,6423,822,919,220,515,018,320,826,122,124,924,824,925,131,628,129,331,026,424,525,432,132,729,138,727,616,9-1,439,9

Broadcom ⭐

Semiconductors, $35 billion in revenue, 40,000 employees

Broadcom mainly acquires other companies and holds many patents, so it is not an organically growing company with a core product. The company is known for its aggressive approach and does not shy away from legal battles. The ticker symbol AVGO comes from a previous company name.
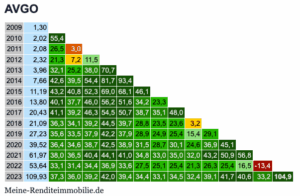
AVGO

AVGO over 14 years - from Dec 2009 until Dec 2023.

20091,30
20102,0255,4
20112,0826,53,0
20122,3221,37,211,5
20133,9632,125,238,070,7
20147,6642,639,554,481,793,4
201511,1943,240,852,369,068,146,1
201613,8040,137,746,056,251,634,223,3
201720,4341,139,246,354,550,738,735,148,0
201821,0936,334,139,244,539,728,823,523,63,2
201927,2335,633,537,942,237,928,924,925,415,429,1
202039,5236,434,638,742,538,931,528,730,124,636,945,1
202161,9738,036,540,444,141,034,833,035,032,043,250,956,8
202253,6433,131,434,436,933,627,525,125,421,326,325,416,5-13,4
2023109,9337,336,039,242,039,434,433,134,532,439,141,740,633,2104,9

Cadence Design Systems

Semiconductor Design and Software, $4 billion in revenue, 11,200 employees

Competitor of Synopsys. Cadence grows more organically, while Synopsys grows more through acquisitions.
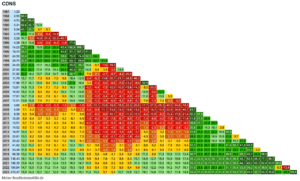
CDNS

CDNS over 36 years - from Dec 1987 until Dec 2023.

19871,33
19882,5088,0
19894,7288,488,8
19905,3158,645,712,5
19915,5843,130,78,75,1
19924,7529,017,40,2-5,4-14,9
19932,5811,70,6-14,0-21,4-32,0-45,7
19944,5819,310,6-0,6-3,6-6,4-1,877,5
199514,0034,227,919,921,425,943,4132,9205,7
199619,7535,029,522,724,528,842,897,1107,741,1
199724,5033,828,922,924,428,038,875,574,932,324,1
199829,7532,628,122,724,027,035,863,159,628,622,721,4
199924,0027,322,817,718,220,026,045,039,314,46,7-1,0-19,3
200027,5026,222,117,417,919,424,540,234,814,58,63,9-3,914,6
200121,9222,218,213,713,814,718,530,725,17,82,1-2,7-9,7-4,4-20,3
200211,7915,711,77,36,97,09,518,412,5-2,4-8,2-13,6-20,7-21,1-34,5-46,2
200317,9817,714,110,09,810,212,921,416,43,2-1,3-5,0-9,6-7,0-13,2-9,452,5
200413,8114,811,37,47,17,29,316,511,7-0,2-4,4-7,9-12,0-10,5-15,8-14,38,2-23,2
200516,9215,211,98,38,08,210,317,012,61,9-1,7-4,5-7,7-5,7-9,3-6,312,8-3,022,5
200617,9114,711,68,27,98,19,916,112,02,3-1,0-3,4-6,1-4,1-6,9-4,011,0-0,113,95,9
200717,0113,610,67,47,17,28,914,410,61,6-1,3-3,6-6,0-4,2-6,6-4,17,6-1,47,20,3-5,0
20083,664,91,9-1,3-2,0-2,5-1,62,4-1,6-9,8-13,1-15,9-18,9-18,9-22,3-22,6-17,7-27,3-28,3-40,0-54,8-78,5
20095,997,14,21,20,60,41,45,41,8-5,9-8,8-11,1-13,6-13,0-15,6-15,0-9,2-16,7-15,4-22,9-30,6-40,763,7
20108,268,35,62,72,22,13,17,13,8-3,5-6,0-8,0-10,1-9,2-11,3-10,3-4,4-10,5-8,2-13,4-17,6-21,450,237,9
201110,408,96,43,73,33,24,28,14,9-1,8-4,2-5,9-7,8-6,7-8,5-7,2-1,4-6,6-4,0-7,8-10,3-11,641,631,825,9
201213,519,77,34,74,34,35,49,16,2-0,2-2,3-3,9-5,5-4,3-5,8-4,31,4-3,1-0,3-3,2-4,6-4,538,631,127,929,9
201314,029,57,14,64,34,35,38,86,10,0-2,0-3,4-4,9-3,8-5,1-3,71,6-2,50,2-2,3-3,4-3,230,823,719,316,13,8
201418,9710,38,15,75,45,56,510,07,41,6-0,2-1,5-2,8-1,6-2,6-1,14,00,53,21,30,71,631,625,923,122,218,535,3
201520,8110,38,25,95,65,66,610,07,52,00,3-0,9-2,1-0,9-1,8-0,44,51,23,82,11,72,628,223,120,318,915,521,89,7
201625,2210,78,66,46,26,27,210,48,12,81,20,2-0,90,3-0,50,95,62,65,13,73,54,527,322,820,419,416,921,615,321,2
201741,8212,210,28,17,98,19,112,310,15,13,62,71,83,12,54,18,86,28,97,88,09,431,127,526,126,125,431,430,141,865,8
201843,4811,910,08,07,87,98,912,09,85,13,72,81,93,22,64,18,56,18,57,57,78,928,124,623,122,721,525,423,027,831,34,0
201969,3613,211,39,49,39,410,413,511,56,95,64,84,15,45,06,611,08,811,410,611,012,430,727,826,726,826,330,529,635,140,128,859,5
2020136,4315,113,311,511,411,712,715,813,99,58,47,87,28,68,310,114,612,715,414,915,617,435,232,932,433,133,538,438,945,752,548,377,196,7
2021186,3515,614,012,212,212,413,516,514,710,59,48,88,39,89,511,315,613,916,516,216,918,635,333,232,733,533,938,238,644,149,245,362,463,936,6
2022160,6414,713,011,311,211,412,515,313,59,58,47,87,38,68,49,914,012,214,614,214,716,131,028,828,128,328,131,130,633,936,230,938,632,38,5-13,8
2023272,3715,914,312,712,712,914,016,815,111,210,29,79,310,710,512,116,114,617,016,717,418,933,331,330,931,331,434,534,537,940,536,744,340,825,920,969,6

Chipotle Mexican Grill

Fast Casual Dining, $9.8 billion in revenue, 116,000 employees

Mexican cuisine is well-suited, in our view, as a flavor profile for potential global expansion; Chipotle is currently primarily in the US, with only two locations in Frankfurt, Germany. Chipotle also caters to the low-carb trend and is on the pricier side—which we consider a positive. McDonald’s was once a 95% owner but has since divested its stake, leaving Chipotle mostly in free float.
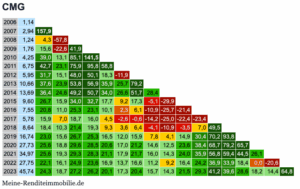
CMG

CMG over 17 years - from Dec 2006 until Dec 2023.

20061,14
20072,94157,9
20081,244,3-57,8
20091,7615,6-22,641,9
20104,2539,013,185,1141,5
20116,7542,723,175,995,858,8
20125,9531,715,148,050,118,3-11,9
201310,6637,623,953,856,935,925,779,2
201413,6936,424,649,250,734,026,651,728,4
20159,6026,715,934,032,717,79,217,3-5,1-29,9
20167,5520,811,025,323,110,12,36,1-10,9-25,7-21,4
20175,7815,97,018,716,04,5-2,6-0,6-14,2-25,0-22,4-23,4
20188,6418,410,321,419,39,33,66,4-4,1-10,9-3,57,049,5
201916,7423,015,626,725,316,512,015,97,84,114,930,470,293,8
202027,7325,618,829,628,520,617,021,214,612,523,638,468,779,265,7
202134,9725,619,329,328,321,117,921,716,014,324,035,956,859,444,526,1
202227,7522,116,124,923,616,913,716,611,29,216,424,236,933,918,40,0-20,6
202345,7424,318,727,226,220,117,320,415,714,321,529,341,239,628,618,214,464,8

Christian Dior

Luxury Goods, $35 billion in revenue, 122,000 employees

Price in EUR. DIO.F = Dior on the Frankfurt Stock Exchange

We have three French luxury goods conglomerates on this list: Dior, Hermès, and LVMH.

Note: Increased effort due to French withholding tax.
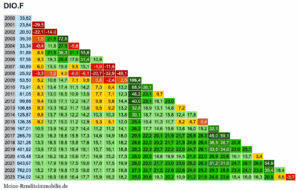
DIO.F

DIO.F over 23 years - from Dec 2000 until Dec 2023.

200033,82
200123,84-29,5
200220,50-22,1-14,0
200335,391,521,872,6
200433,34-0,411,827,5-5,8
200551,898,921,536,321,155,6
200657,569,319,329,417,631,410,9
200750,896,013,519,99,515,1-1,0-11,6
200825,92-3,31,24,0-6,0-6,1-20,7-32,9-49,1
200953,505,210,614,77,19,90,8-2,42,5106,4
201073,918,113,417,411,114,27,36,413,268,938,1
201181,058,313,016,510,913,57,77,112,346,223,19,7
201299,689,413,917,112,214,79,89,614,440,023,116,123,0
2013106,889,313,316,211,713,89,59,213,232,818,913,114,87,2
2014125,879,813,716,312,214,210,310,313,830,118,714,215,812,417,8
2015126,389,212,715,011,212,99,39,112,025,415,411,311,78,28,70,4
2016167,0110,513,916,212,714,411,211,214,126,217,714,615,613,816,015,232,1
2017265,7912,916,318,615,517,314,614,918,029,522,220,121,921,725,628,345,059,1
2018321,2613,316,518,815,817,615,115,418,228,622,020,221,721,524,626,436,538,720,9
2019401,8213,917,019,116,418,115,716,118,828,322,320,722,222,024,726,133,534,023,025,1
2020415,4813,416,218,215,617,114,915,217,526,020,518,819,919,521,422,026,925,616,113,73,4
2021643,6715,117,919,917,519,017,017,519,928,023,021,723,023,025,226,331,231,024,726,126,654,9
2022762,0315,217,919,817,519,017,117,519,827,322,721,522,622,624,425,229,328,823,424,123,835,418,4
2023734,0214,316,918,616,417,715,916,218,225,020,619,320,219,921,221,624,623,618,418,016,320,96,8-3,7

Cintas

Workwear and Uniforms, $10 billion in revenue, 46,000 employees

Who would have thought that workwear, uniforms, sanitary needs, and fire protection could be so profitable? Cintas rents, cleans, collects, and delivers workwear and uniforms in a subscription system for about one million companies in the US.
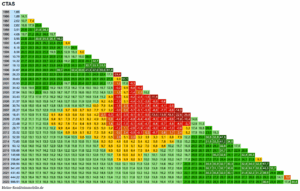
CTAS

CTAS over 38 years - from Dec 1985 until Dec 2023.

19851,65
19861,8814,1
19872,0210,77,4
19882,6216,617,929,4
19893,5120,823,131,834,3
19904,0619,721,226,224,615,7
19915,9523,825,930,931,530,146,3
19926,4521,522,826,125,322,425,98,4
19938,1622,123,326,225,523,426,117,126,5
19948,5620,120,822,921,819,520,512,915,35,0
199510,7920,721,423,322,420,621,616,118,715,026,0
199614,3221,722,524,323,722,223,419,222,120,629,332,7
199719,1222,623,525,224,723,624,821,524,323,730,733,133,5
199834,6726,427,529,529,529,030,728,632,433,641,947,655,681,4
199926,2321,822,523,823,322,323,020,422,221,525,124,922,417,1-24,4
200039,6323,624,325,725,424,625,623,525,525,329,129,729,027,56,951,1
200135,9321,221,722,822,321,421,919,721,020,422,722,220,217,11,217,0-9,3
200234,4219,619,920,820,219,219,517,318,217,419,018,015,712,5-0,29,5-6,8-4,2
200337,9419,019,320,119,518,518,716,717,516,618,017,014,912,11,89,7-1,42,810,2
200433,4317,217,317,917,316,216,214,214,713,714,613,411,28,3-0,65,0-4,2-2,4-1,5-11,9
200531,5715,916,016,515,814,714,612,713,011,912,611,39,26,5-1,33,1-4,4-3,2-2,8-8,8-5,6
200630,7414,915,015,414,713,613,511,611,810,711,210,07,95,4-1,52,3-4,1-3,1-2,8-6,8-4,1-2,6
200726,2713,413,413,712,911,811,69,79,88,79,07,75,73,2-3,00,0-5,7-5,1-5,3-8,8-7,7-8,8-14,5
200818,4111,110,911,110,29,18,86,96,85,65,64,22,1-0,3-6,1-3,9-9,1-9,1-9,9-13,5-13,9-16,5-22,6-29,9
200921,0911,211,111,210,49,49,17,37,26,16,24,93,00,8-4,4-2,2-6,8-6,4-6,8-9,3-8,8-9,6-11,8-10,414,6
201023,4811,211,111,210,59,59,27,57,46,46,55,33,61,6-3,2-1,0-5,1-4,6-4,7-6,6-5,7-5,8-6,5-3,712,911,3
201129,7711,811,711,911,210,29,98,48,47,57,66,55,03,2-1,21,1-2,6-1,9-1,6-3,0-1,6-1,0-0,63,217,418,826,8
201235,5212,012,012,111,510,610,48,98,98,18,27,35,84,20,22,4-0,9-0,10,3-0,70,81,72,46,217,919,023,019,3
201352,5013,213,113,312,711,911,810,410,59,810,09,27,96,52,85,12,23,23,93,35,16,67,912,223,325,630,832,847,8
201470,8013,813,814,113,512,812,611,411,510,811,110,49,38,04,66,84,25,46,25,87,89,411,015,225,227,431,833,541,234,8
201583,1214,014,014,213,712,912,811,611,811,111,410,79,78,55,37,55,16,27,06,88,610,211,715,524,025,728,829,332,825,817,4
2016106,8614,414,414,714,213,513,412,212,411,812,211,510,69,56,58,66,47,58,48,310,211,713,316,924,626,128,729,131,726,722,928,6
2017145,6815,015,115,314,914,214,213,113,312,813,112,611,710,77,810,08,09,110,110,112,013,615,218,725,827,329,830,332,629,127,232,436,3
2018158,8414,814,915,114,714,014,012,913,112,612,912,411,610,67,99,98,09,110,010,011,813,214,717,824,025,127,027,028,424,822,424,121,99,0
2019256,9016,016,116,315,915,415,414,414,614,214,614,113,412,510,012,110,311,512,612,714,616,217,720,927,128,430,530,932,730,329,432,634,032,861,7
2020341,0016,516,516,816,415,915,915,015,214,815,214,814,113,310,913,011,412,613,613,815,617,218,821,827,528,830,731,132,730,630,032,633,732,846,532,7
2021431,4016,716,817,116,716,216,215,415,615,215,615,214,613,911,613,612,013,214,214,516,217,819,322,127,528,630,330,632,030,129,531,632,231,239,529,626,5
2022444,2216,316,416,716,315,815,814,915,214,815,114,814,113,411,213,111,612,713,613,815,516,818,220,725,526,427,827,928,726,825,827,126,825,029,320,014,13,0
2023598,9116,816,917,116,816,316,315,515,715,415,815,414,814,212,113,912,513,614,614,816,417,819,121,626,127,028,328,429,327,626,828,027,926,630,423,620,717,834,8

Deere & Company

Agricultural Machinery, $53 billion in revenue, 82,000 employees

John Deere, the Apple of agricultural machinery, is on the lower end in terms of returns and is intended to bring stability to the portfolio. Deere controls the entire ecosystem from machinery to software to service centers.
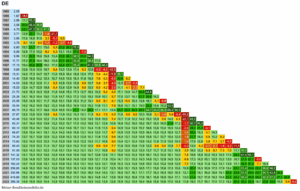
DE

DE over 38 years - from Dec 1985 until Dec 2023.

19852,05
19861,67-18,5
19872,5611,753,3
19883,5820,446,439,8
19894,7023,141,235,531,3
19903,7112,622,113,21,8-21,1
19913,9511,618,811,53,3-8,36,5
19923,769,114,58,01,2-7,20,7-4,8
19936,6015,721,717,113,08,921,229,375,5
19946,0812,817,513,29,25,313,115,527,2-7,9
19959,9917,222,018,615,813,421,926,138,523,064,3
199611,7117,221,518,416,013,921,124,332,821,138,817,2
199717,1319,423,620,919,017,524,427,735,426,941,230,946,3
19989,8512,815,913,010,78,613,013,917,48,312,8-0,5-8,3-42,5
199913,3114,317,314,712,711,015,316,419,812,417,07,44,4-11,935,1
200014,4013,916,614,212,310,714,515,518,311,815,57,65,3-5,620,98,2
200114,0312,815,212,911,19,512,913,515,89,912,75,83,7-4,912,52,7-2,6
200215,0312,414,712,510,89,412,412,914,99,612,06,04,2-2,611,14,12,27,1
200321,7314,016,314,312,811,614,615,317,312,715,210,29,24,017,113,014,724,544,6
200425,2614,116,314,413,011,914,715,317,213,015,310,910,15,717,013,715,121,729,616,2
200523,5513,014,913,111,710,613,113,615,211,213,19,08,14,113,310,010,313,816,14,1-6,8
200633,5414,216,214,513,212,314,815,316,913,315,311,611,17,816,614,115,119,022,215,615,242,4
200766,7517,219,217,716,615,918,519,321,118,020,217,117,114,623,722,324,529,734,732,438,368,499,0
200827,8712,013,612,010,89,811,912,213,310,111,58,27,54,511,08,68,610,310,85,12,55,8-8,8-58,2
200940,4613,214,913,412,211,413,413,815,012,013,510,510,07,413,711,812,214,215,210,99,914,56,5-22,145,2
201063,3114,716,415,013,913,215,215,717,014,215,813,112,810,616,815,216,018,219,716,516,521,917,2-1,750,756,5
201160,1013,915,414,113,012,314,214,615,713,114,411,911,59,414,913,413,915,716,613,613,216,912,4-2,629,221,9-5,1
201268,6713,915,414,113,112,414,214,615,613,114,412,011,79,714,913,513,915,516,413,613,316,512,70,625,319,34,114,3
201374,3013,715,113,812,912,213,914,315,312,914,111,811,59,614,413,113,514,915,613,112,715,412,01,821,716,45,511,28,2
201473,8213,214,513,312,311,613,313,614,512,213,311,110,89,013,412,112,413,614,211,811,313,510,41,417,612,83,97,13,7-0,6
201565,4312,213,512,311,410,712,212,413,211,012,09,99,57,711,810,510,611,612,09,69,010,87,7-0,213,08,30,72,1-1,6-6,2-11,4
201691,0913,014,313,112,311,613,113,414,212,113,111,110,89,213,212,012,213,313,711,711,313,110,53,516,012,36,38,77,37,011,139,2
2017141,3214,115,414,313,512,914,414,815,613,614,712,812,611,115,014,014,415,516,114,314,216,114,07,819,816,912,215,315,517,424,247,055,1
2018137,0313,614,813,712,912,313,814,014,812,913,912,111,810,414,113,113,314,314,813,112,814,512,46,817,314,510,112,512,213,016,727,922,7-3,0
2019162,2413,714,913,813,112,513,914,215,013,114,012,312,110,814,313,313,614,615,013,413,214,812,97,717,414,911,013,213,113,917,125,521,27,118,4
2020256,6514,816,015,014,313,815,215,516,314,515,513,913,712,516,015,115,516,517,115,615,617,315,610,920,318,315,017,517,919,423,131,429,622,036,958,2
2021330,6615,216,315,414,714,215,615,916,715,016,014,414,313,116,515,716,117,117,716,316,318,016,512,121,019,116,218,619,120,523,931,029,423,734,142,828,8
2022418,6815,516,615,715,014,615,916,217,015,416,314,814,713,616,916,216,617,618,116,816,918,417,113,021,419,717,019,319,821,224,230,428,924,332,237,227,726,6
2023395,3914,915,915,014,413,915,215,516,214,615,514,013,912,815,915,215,516,416,815,615,617,015,611,819,317,715,117,017,318,220,525,223,318,723,624,915,59,4-5,6

Dell Technologies ⭐

Computer Hardware and Storage, $88 billion in revenue, 120,000 employees

Founder and namesake Michael Dell is still—or once again—leading the company. Dell Inc. and Dell EMC are subsidiaries of Dell Technologies. The company was delisted in 2013 to undergo restructuring in peace, then re-listed in 2018.
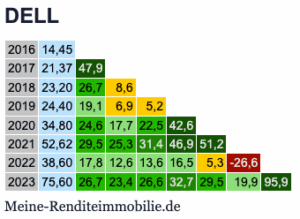
DELL

DELL over 7 years - from Dec 2016 until Dec 2023.

201614,45
201721,3747,9
201823,2026,78,6
201924,4019,16,95,2
202034,8024,617,722,542,6
202152,6229,525,331,446,951,2
202238,6017,812,613,616,55,3-26,6
202375,6026,723,426,632,729,519,995,9

DexCom

Medical Devices, $3.6 billion in revenue, 9,600 employees

DexCom manufactures continuous glucose monitors for diabetes patients. The Dexcom share price dropped sharply at the end of July 2024 and has been moving sideways since (as of 10/16/2024), following the CEO’s statements during an earnings call about internal issues with the sales team and resulting revenue drops.
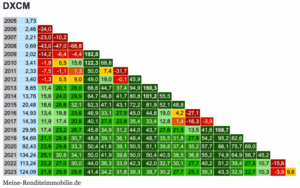
DXCM

DXCM over 18 years - from Dec 2005 until Dec 2023.

20053,73
20062,46-34,0
20072,21-23,0-10,2
20080,69-43,0-47,0-68,8
20092,02-14,2-6,4-4,4192,8
20103,41-1,88,515,6122,368,8
20112,33-7,5-1,11,350,07,4-31,7
20123,40-1,35,59,049,019,0-0,145,9
20138,8511,420,126,066,644,737,494,9160,3
201413,7615,624,029,964,746,841,780,8101,255,5
201520,4818,626,632,162,347,143,172,281,952,148,8
201614,9313,419,823,646,933,127,945,044,819,04,2-27,1
201714,3511,917,420,640,127,822,835,433,412,81,4-16,3-3,9
201829,9517,423,226,745,834,931,244,043,727,621,513,541,6108,7
201954,6921,126,930,748,839,136,148,448,735,531,827,854,295,282,6
202092,4323,929,633,350,441,639,150,551,139,837,435,257,786,175,769,0
2021134,2425,130,634,150,041,939,650,050,440,538,536,855,274,964,956,745,2
2022113,2422,227,030,044,036,333,942,342,032,730,127,740,251,239,427,510,7-15,6
2023124,0921,525,928,641,434,231,839,338,730,227,725,335,343,332,922,710,3-3,99,6

Eli Lilly ⭐

Pharma, $34 billion in revenue, 43,000 employees

The world’s most valuable pharmaceutical company, producing the antidepressant Prozac, used by at least 20 million people in the US. Additional revenue generators include diabetes treatments. More than a quarter of revenue (not just profit) is invested in research. Eli Lilly has outperformed strong European competitor Novo Nordisk in recent years, although Novo Nordisk has historically been less volatile and is also on this list.

Both Eli Lilly (“Mounjaro” or tirzepatide) and Novo Nordisk (“Ozempic” or semaglutide) offer medications suitable (also) for weight loss, with Eli Lilly’s product seeming to be more effective at comparable side effects.
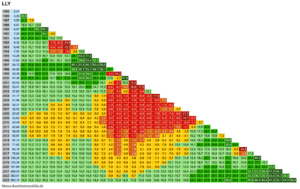
LLY

LLY over 38 years - from Dec 1985 until Dec 2023.

19852,41
19863,3036,8
19873,5521,37,5
19884,0118,410,112,8
19896,5728,525,836,164,1
19907,2024,421,526,634,19,5
19918,4223,120,624,128,113,217,0
19926,3314,811,412,212,1-1,3-6,3-24,9
19936,4813,110,110,610,1-0,4-3,4-12,32,4
19947,5013,410,811,311,02,71,0-3,88,815,6
199513,2918,616,717,918,712,413,012,128,143,277,3
199617,6319,818,219,520,415,116,115,929,239,653,432,7
199734,1224,723,625,426,922,924,926,340,151,565,760,293,5
199844,0625,024,125,727,123,525,426,738,246,755,749,158,129,1
199933,3820,619,520,521,317,618,618,826,831,434,825,923,7-1,1-24,2
200047,3621,920,922,122,919,720,721,228,632,936,028,928,011,53,741,9
200140,5319,318,219,019,516,417,017,022,925,827,320,418,14,4-2,710,2-14,4
200233,4116,715,616,116,413,313,613,318,120,020,514,111,2-0,4-6,70,0-16,0-17,6
200337,8016,515,415,916,113,313,613,317,619,319,714,011,51,7-3,03,2-7,2-3,413,1
200431,1714,413,313,613,710,911,010,614,215,315,39,97,4-1,3-5,6-1,4-9,9-8,4-3,4-17,5
200531,9613,812,713,013,010,410,410,013,314,214,19,26,8-0,8-4,5-0,7-7,6-5,8-1,5-8,02,5
200630,3112,811,711,911,99,49,48,911,812,612,37,85,6-1,3-4,6-1,4-7,2-5,6-2,4-7,1-1,4-5,2
200732,0212,511,411,611,69,29,28,711,412,111,87,65,6-0,6-3,5-0,5-5,4-3,9-0,8-4,10,90,15,7
200825,2010,79,79,89,67,37,26,79,09,59,05,03,0-2,7-5,4-3,1-7,6-6,6-4,6-7,8-5,2-7,6-8,8-21,3
200923,6310,08,99,08,86,66,55,98,18,48,04,22,3-3,0-5,5-3,4-7,4-6,5-4,8-7,5-5,4-7,3-8,0-14,1-6,2
201024,499,78,78,88,66,56,35,87,88,17,74,22,4-2,5-4,8-2,8-6,4-5,4-3,8-6,0-3,9-5,2-5,2-8,5-1,43,7
201130,6610,39,39,49,37,27,16,78,79,08,65,43,8-0,8-2,7-0,7-3,9-2,8-0,9-2,6-0,2-0,70,2-1,16,813,925,2
201238,0910,89,910,09,87,97,97,59,49,89,56,44,90,7-1,01,0-1,8-0,61,30,12,52,53,93,510,917,324,724,2
201340,8710,69,89,99,77,97,87,49,39,69,36,45,11,1-0,51,5-1,10,11,80,83,13,14,44,110,214,718,615,57,3
201457,1211,510,710,810,89,09,08,710,510,910,78,06,73,11,63,61,32,74,63,86,26,78,28,614,619,323,623,022,439,8
201571,6212,011,211,311,39,69,69,311,111,511,38,87,74,22,94,92,84,26,05,57,98,410,010,616,120,323,923,623,432,425,4
201664,1911,210,410,510,48,88,88,510,110,510,37,86,73,42,13,91,93,14,84,26,26,57,88,012,415,317,415,913,916,26,0-10,4
201775,6411,410,610,710,79,19,18,810,410,810,68,27,24,12,94,62,84,05,65,17,17,48,79,013,015,717,516,214,716,69,82,817,8
2018106,2412,211,511,611,510,110,19,811,511,811,79,58,55,64,56,34,65,87,57,19,29,711,011,515,518,220,119,418,621,116,814,028,640,5
2019123,3912,311,611,711,710,310,310,111,612,011,99,78,86,05,06,85,26,48,07,79,610,111,411,915,518,019,719,018,320,216,714,624,327,716,1
2020161,6912,812,112,312,310,910,910,712,312,712,510,59,77,06,17,86,37,69,28,910,811,412,713,316,819,120,820,319,821,718,917,726,028,823,431,0
2021268,5314,013,413,613,612,312,412,213,814,214,212,311,59,08,29,98,69,911,611,513,514,215,716,420,022,524,324,224,226,524,724,633,137,336,247,566,1
2022360,5114,513,914,114,212,913,012,914,414,914,813,012,39,99,210,99,711,012,612,614,615,316,717,520,923,325,125,125,227,425,926,033,336,735,743,049,334,3
2023580,1015,515,015,215,314,114,214,115,716,216,214,413,811,510,912,611,512,914,614,616,617,519,019,823,325,727,627,828,130,429,429,937,040,440,447,353,147,060,9

Entegris

Semiconductor Materials and Equipment, $3.5 billion in revenue, 8,000 employees

Entegris operates in 10 countries, including Germany, and supplies materials and equipment for semiconductor production and other high-tech industries.
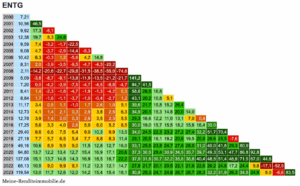
ENTG

ENTG over 23 years - from Dec 2000 until Dec 2023.

20007,21
200110,5646,5
20029,9217,3-6,1
200312,3819,78,324,8
20049,597,4-3,2-1,7-22,5
20059,084,7-3,7-2,9-14,4-5,3
200610,426,3-0,31,2-5,64,214,8
20078,312,0-3,9-3,5-9,5-4,7-4,3-20,2
20082,11-14,2-20,6-22,7-29,8-31,5-38,5-55,0-74,6
20095,09-3,8-8,7-9,1-13,8-11,9-13,5-21,2-21,7141,2
20107,200,0-4,2-3,9-7,5-4,7-4,5-8,8-4,784,741,5
20118,411,4-2,3-1,8-4,7-1,9-1,3-4,20,358,628,516,8
20128,841,7-1,6-1,1-3,7-1,0-0,4-2,71,243,120,210,85,1
201311,173,40,51,1-1,01,72,61,05,139,621,715,815,226,4
201412,734,11,42,10,32,93,82,56,334,920,115,314,820,014,0
201512,783,91,42,00,32,63,52,35,529,316,612,211,013,17,00,4
201617,255,63,34,02,65,06,05,28,530,019,015,715,518,215,616,435,0
201729,408,66,67,56,49,010,39,913,534,024,522,323,227,227,432,251,770,4
201827,187,75,76,55,47,78,88,311,429,120,518,118,220,619,520,928,625,5-7,6
201949,1610,68,99,99,011,512,812,716,033,125,523,824,727,828,031,040,041,829,380,9
202094,8013,712,213,412,715,416,917,120,637,330,529,430,934,535,739,749,353,147,786,892,8
2021137,0815,113,714,814,316,918,518,722,237,931,630,732,235,636,840,448,551,446,971,567,044,6
202265,1310,59,09,99,111,212,312,114,727,821,720,120,522,121,622,626,224,817,224,49,8-17,1-52,5
2023119,5413,011,712,612,014,215,415,418,130,925,324,124,826,726,728,332,231,926,334,524,98,0-6,683,5

Ferrari

Automotive, $6 billion in revenue, 5,000 employees

The future of internal combustion engines is uncertain, but the first electric Ferrari is expected in 2025. Ferrari might also be more appropriately classified as a luxury brand, which we consider to have a promising future. Although Ferrari has only an eight-year history, it has performed remarkably well for an automotive stock.
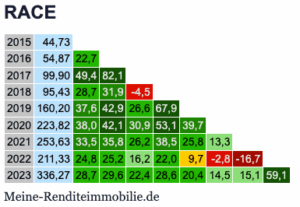
RACE

RACE over 8 years - from Dec 2015 until Dec 2023.

201544,73
201654,8722,7
201799,9049,482,1
201895,4328,731,9-4,5
2019160,2037,642,926,667,9
2020223,8238,042,130,953,139,7
2021253,6333,535,826,238,525,813,3
2022211,3324,825,216,222,09,7-2,8-16,7
2023336,2728,729,622,428,620,414,515,159,1

FICO (Fair Isaac & Co.) ⭐

Software for Financial Services, $1.5 billion in revenue, 3,500 employees

For decades, FICO (Fair Isaac and Company), known as the “American Schufa,” practically didn’t charge for its service. In recent years, with over 90% market share in credit scores, an essential service in the US, FICO has gradually raised fees, first for real estate, next for credit cards, and so on. Fees remain in the cents range or a few dollars per inquiry, with plenty of room for further increases. Half of the revenue comes from fraud detection software, while the other half comes from the credit score service, which is more profitable.

The revenue volume comes not from high prices but from the extremely high frequency of credit score inquiries in the US. FICO serves inquiries related to credit cards, real estate loans, and consumer credit, particularly for car purchases. Strong network effect due to its established position, with no interest on the customer’s side to switch due to the low fees. Although the potential for price increases may already be priced in, it is still an interesting stock with unique features, especially after a significant pullback.
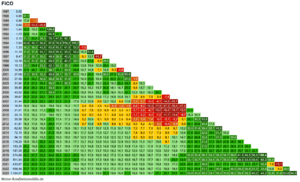
FICO

FICO over 36 years - from Dec 1987 until Dec 2023.

19870,62
19880,8537,1
19890,8617,81,2
19900,641,1-13,2-25,6
19911,4423,519,229,4125,0
19921,7322,819,426,264,420,1
19933,1531,130,038,370,147,982,1
19947,9343,945,155,987,676,6114,1151,7
19957,3336,236,042,962,850,261,852,5-7,6
199611,1037,837,944,160,950,459,252,218,351,4
19979,4731,330,735,046,936,940,531,76,113,7-14,7
199813,1632,031,535,445,937,240,233,113,521,58,939,0
199915,1330,529,933,242,134,236,329,913,819,910,926,415,0
200014,5927,526,729,436,729,330,524,510,714,87,115,55,3-3,6
200127,0831,030,533,340,634,135,730,919,224,319,530,027,233,885,6
200227,5828,828,230,636,830,831,927,316,920,816,423,820,322,237,51,8
200331,8027,927,329,435,029,430,326,016,720,116,222,419,320,429,78,415,3
200435,6526,926,328,233,328,028,724,716,219,215,720,818,118,725,09,613,712,1
200543,0226,626,027,732,427,528,024,316,619,416,220,818,419,024,112,316,016,320,7
200639,6724,523,825,329,424,725,121,514,416,613,617,314,814,818,17,99,57,65,5-7,8
200731,4421,720,922,125,721,321,317,911,212,99,912,710,29,611,62,52,7-0,3-4,1-14,5-20,7
200816,5416,916,016,819,815,415,211,75,46,53,45,22,31,01,6-6,8-8,2-12,3-17,5-27,3-35,4-47,4
200921,0117,416,517,320,216,115,812,66,77,85,06,94,33,34,1-3,1-3,8-6,7-10,0-16,4-19,1-18,327,0
201023,1317,016,217,019,615,715,512,46,98,05,47,14,83,94,7-1,7-2,2-4,4-7,0-11,7-12,6-9,718,310,1
201135,5818,417,618,421,117,417,314,49,210,48,19,98,07,48,42,82,91,40,0-3,1-2,23,129,130,153,8
201241,8118,317,618,420,917,417,314,69,710,88,610,48,68,19,24,04,23,12,0-0,40,95,926,125,834,417,5
201362,6219,418,819,622,118,718,616,111,512,710,712,511,010,711,97,27,77,06,54,86,712,230,531,439,432,749,8
201472,1519,318,619,421,818,618,516,111,712,811,012,711,211,012,17,88,37,77,35,97,812,627,828,032,926,631,415,2
201594,1019,619,019,822,119,019,016,712,513,611,913,612,312,113,29,39,99,59,28,110,114,728,228,432,427,531,022,630,4
2016119,2019,919,320,022,319,319,317,113,114,212,614,313,012,914,010,411,010,710,69,711,616,028,028,131,427,429,923,928,526,7
2017153,2020,219,620,322,519,719,617,613,714,813,314,913,813,714,811,412,111,911,911,213,117,228,128,231,027,529,725,128,527,628,5
2018187,0020,219,720,422,519,819,717,714,115,113,715,314,214,115,212,012,712,512,612,013,817,627,427,529,926,728,424,526,925,725,322,1
2019374,6822,221,722,524,622,022,020,216,717,816,518,217,317,418,615,716,616,717,016,718,922,932,833,436,334,236,834,739,041,346,556,4100,4
2020511,0422,622,122,925,022,422,520,717,418,517,318,918,118,219,516,717,617,718,117,920,023,933,133,736,334,536,735,038,640,343,949,465,336,4
2021433,6721,220,821,523,421,021,019,216,017,015,817,316,416,517,514,915,615,615,815,517,320,628,628,730,528,429,727,429,229,029,529,732,47,6-15,1
2022598,5821,721,321,923,821,521,519,816,717,716,618,017,217,318,415,916,616,717,016,818,521,729,229,431,129,330,528,530,330,330,931,333,816,98,238,0
20231.164,0123,322,923,625,523,323,421,818,819,818,820,319,619,821,018,619,519,720,120,122,025,332,833,235,233,735,333,936,236,938,540,244,232,831,663,894,5

Fortinet ⭐

IT Security (Cybersecurity), $5.3 billion in revenue, 13,500 employees

Fortinet, not to be confused with the game Fortnite, competes with Palo Alto Networks. Fortinet is more affordable and considered better suited for smaller businesses and simpler requirements.
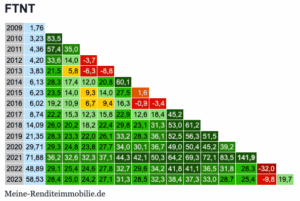
FTNT

FTNT over 14 years - from Dec 2009 until Dec 2023.

20091,76
20103,2383,5
20114,3657,435,0
20124,2033,614,0-3,7
20133,8321,55,8-6,3-8,8
20146,1328,317,412,020,860,1
20156,2323,514,09,314,027,51,6
20166,0219,210,96,79,416,3-0,9-3,4
20178,7422,215,312,315,822,912,618,445,2
201814,0926,020,218,222,429,823,131,353,061,2
201921,3528,323,322,026,133,228,336,152,556,351,5
202029,7129,324,823,827,734,030,136,749,050,445,239,2
202171,8836,232,632,337,144,342,150,364,269,372,183,5141,9
202248,8929,125,424,627,832,729,634,241,841,136,531,828,3-32,0
202358,5328,425,024,227,131,328,532,338,437,333,028,725,4-9,819,7

HEICO

Aerospace, $2.2 billion in revenue, 6,500 employees

HEICO is the largest FAA-certified supplier of replacement parts for the civil and military aviation industries.
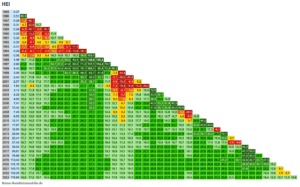
HEI

HEI over 38 years - from Dec 1985 until Dec 2023.

19850,27
19860,5188,9
19870,281,8-45,1
19880,314,7-22,010,7
19890,26-0,9-20,1-3,6-16,1
19900,291,4-13,21,2-3,311,5
19910,333,4-8,34,22,112,713,8
19920,353,8-6,14,63,110,49,96,1
19930,311,7-6,91,70,04,52,2-3,1-11,4
19940,26-0,4-8,1-1,1-2,90,0-2,7-7,6-13,8-16,1
19950,587,91,49,59,414,314,915,118,336,8123,1
19961,4816,711,220,321,628,231,235,043,468,4138,6155,2
19972,6621,016,225,227,033,737,241,650,071,2117,1114,279,7
19984,4224,019,728,530,437,040,644,952,670,1103,196,872,866,2
19993,0618,914,822,123,128,029,932,136,346,563,751,627,47,3-30,8
20002,4215,711,818,018,722,523,624,827,334,145,033,113,1-3,1-26,0-20,9
20012,5715,111,417,217,721,021,922,824,830,338,728,211,7-0,9-16,5-8,46,2
20021,8211,98,313,313,516,116,516,817,921,727,517,73,5-7,3-19,9-15,9-13,3-29,2
20033,1314,611,316,316,719,420,120,622,026,031,823,511,32,7-6,70,69,010,472,0
20044,2915,712,617,417,820,521,221,823,227,032,424,914,27,1-0,57,015,418,653,537,1
20054,9315,612,717,317,720,220,821,322,625,930,723,914,38,01,68,315,317,739,425,514,9
20067,4117,114,318,819,321,822,523,124,427,732,226,117,512,16,713,520,523,642,033,331,450,3
200710,4218,115,519,820,322,823,524,125,428,532,827,219,414,610,016,623,226,341,835,134,445,440,6
20087,4515,513,016,917,219,319,820,121,123,627,121,714,49,85,410,415,116,426,518,914,814,80,3-28,5
20098,5315,513,016,817,119,119,519,820,723,026,221,214,410,26,210,815,016,224,718,214,714,74,8-9,514,5
201012,3116,514,217,918,220,220,621,021,924,227,322,616,312,58,913,517,719,027,021,619,220,113,55,728,544,3
201117,6717,415,218,919,221,121,622,022,925,228,223,818,014,511,215,719,821,328,724,222,423,719,014,133,443,943,5
201216,9516,614,417,818,119,920,320,621,423,426,122,016,513,110,114,117,618,725,020,618,719,314,810,222,825,717,3-4,1
201328,9418,216,119,519,921,722,222,623,425,528,124,319,116,113,317,421,022,428,624,923,624,821,518,631,235,733,028,070,7
201430,4117,715,719,019,321,021,421,722,524,426,923,218,315,412,816,519,820,926,423,021,622,419,316,526,428,925,419,833,95,1
201527,4316,714,717,818,119,620,020,220,922,624,821,316,613,811,314,717,618,423,219,818,418,715,712,920,521,517,411,617,4-2,6-9,8
201639,0417,415,618,618,920,420,821,021,723,425,622,217,815,212,916,219,019,924,521,420,220,718,115,823,024,321,217,223,210,513,342,3
201759,8118,416,619,619,921,421,822,122,824,526,723,519,316,814,718,020,821,726,223,522,523,120,919,126,027,625,322,528,719,925,347,753,2
201876,8818,717,019,920,221,722,122,423,024,726,823,719,717,415,418,521,222,126,423,822,923,521,519,926,327,725,723,428,721,626,141,040,328,5
2019113,4319,417,820,621,022,522,923,223,925,527,524,620,818,616,719,822,423,427,525,224,425,123,422,028,129,528,026,231,225,630,142,642,737,747,5
2020131,7619,317,720,520,822,322,622,923,625,127,124,220,618,516,719,622,123,026,924,623,924,522,821,627,028,326,825,029,224,227,736,935,530,130,916,2
2021143,7019,017,520,120,421,822,222,523,124,526,323,620,118,116,319,121,522,325,923,722,923,521,920,625,626,525,023,326,822,224,831,829,824,523,212,69,1
2022153,2918,717,219,720,021,321,621,922,523,925,622,919,517,615,918,620,821,524,822,722,022,420,819,624,124,923,421,724,620,422,427,925,620,718,810,67,96,7
2023178,6818,617,219,719,921,221,521,722,323,625,322,719,417,615,918,520,621,324,422,421,722,120,619,423,624,322,821,323,920,021,726,424,320,018,412,010,711,516,6

Hermès

Luxury Goods, $13.5 billion in revenue, 22,000 employees

Price in EUR. HMI.BE = Hermès on the Berlin Stock Exchange

One of the French luxury conglomerates with top returns, alongside LVMH and Christian Dior. Hermès is remarkably high-performing for a non-tech company.

Note: Increased effort due to French withholding tax.
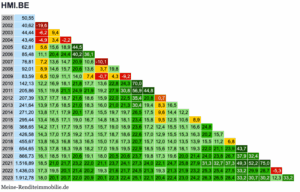
HMI.BE

HMI.BE over 22 years - from Dec 2001 until Dec 2023.

200150,55
200240,62-19,6
200344,44-6,29,4
200443,46-4,93,4-2,2
200562,815,615,618,944,5
200685,4811,120,424,440,236,1
200776,817,213,614,720,910,6-10,1
200892,018,914,615,720,613,63,719,8
200983,596,510,911,114,07,4-0,74,3-9,2
2010142,1312,216,918,121,817,713,622,824,370,0
2011205,8615,119,821,124,921,919,227,930,856,944,8
2012207,3913,717,718,721,618,615,922,022,535,420,80,7
2013241,6413,917,618,521,018,316,021,021,330,419,48,316,5
2014271,2013,817,117,920,117,615,519,719,726,517,59,614,412,2
2015295,4413,416,517,119,016,714,818,318,123,415,89,512,510,68,9
2016368,6514,217,117,719,517,515,719,018,923,617,212,415,515,116,624,8
2017426,5814,317,017,519,217,315,718,718,622,617,012,915,515,316,320,215,7
2018455,6713,816,316,818,316,515,017,617,320,715,712,014,013,513,915,511,26,8
2019654,6515,317,818,319,818,217,019,519,522,918,515,617,818,119,322,021,123,943,7
2020866,7316,118,519,120,619,118,020,520,623,719,817,319,620,021,424,023,826,737,932,4
20211.516,8918,521,021,723,222,021,123,724,127,324,022,124,725,827,931,332,737,349,352,275,0
20221.436,0317,319,520,121,420,219,321,621,724,521,319,321,321,923,225,325,427,533,229,928,7-5,3
20231.912,7818,020,120,722,020,920,122,322,425,122,120,422,423,024,226,326,528,433,230,730,212,333,2

Hubspot

Software, $2.17 billion in revenue, 7,600 employees

Software-as-a-Service for sales, marketing, and CRM (Customer Relationship Management). The major competitor is Salesforce, which is more expensive and targets larger companies, while Hubspot is considered the best comprehensive package, especially for small to medium-sized businesses.
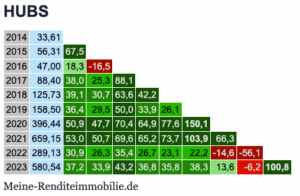
HUBS

HUBS over 9 years - from Dec 2014 until Dec 2023.

201433,61
201556,3167,5
201647,0018,3-16,5
201788,4038,025,388,1
2018125,7339,130,763,642,2
2019158,5036,429,550,033,926,1
2020396,4450,947,770,464,977,6150,1
2021659,1553,050,769,665,273,7103,966,3
2022289,1330,926,335,426,723,122,2-14,6-56,1
2023580,5437,233,943,236,835,838,313,6-6,2100,8

IDEXX Laboratories

Animal Health, $3.7 billion in revenue, 11,000 employees

IDEXX manufactures analytical equipment and other products for health monitoring, such as blood analysis for pets and livestock, and sells them in 175 countries. The company has two locations in Germany.
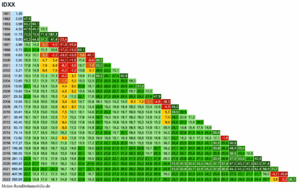
IDXX

IDXX over 32 years - from Dec 1991 until Dec 2023.

19911,39
19922,0547,5
19933,9869,294,1
19944,5047,948,213,1
199511,7570,579,071,8161,1
19969,0045,344,831,341,4-23,4
19973,9819,214,20,0-4,0-41,8-55,8
19986,7325,321,911,110,6-17,0-13,569,1
19994,0314,210,10,2-2,2-23,5-23,50,6-40,1
20005,5016,513,14,73,4-14,1-11,611,4-9,636,5
20017,1317,814,97,66,8-8,0-4,615,71,933,029,6
20028,2117,514,98,47,8-5,0-1,515,65,126,822,215,1
200311,5719,317,011,311,1-0,23,719,511,430,228,127,440,9
200413,6519,217,111,911,71,75,319,312,527,625,524,228,918,0
200518,0020,118,213,413,44,48,020,815,128,326,826,129,924,731,9
200619,8319,417,613,113,24,98,219,514,525,623,822,724,719,720,510,2
200729,3221,019,415,315,57,911,322,117,828,227,026,629,026,229,027,647,9
200818,0416,314,610,610,43,46,014,710,418,116,014,214,09,37,20,1-4,6-38,5
200926,7317,916,312,612,66,08,717,213,420,819,218,018,415,014,410,410,5-4,548,2
201034,6118,417,013,613,67,510,118,114,621,620,219,219,716,916,814,014,95,738,529,5
201138,4818,116,713,413,57,710,217,614,420,719,318,418,716,216,013,514,27,028,720,011,2
201246,4018,216,913,813,88,410,817,814,820,719,418,618,916,716,514,515,29,626,620,215,820,6
201353,1918,016,813,813,98,811,017,614,820,219,118,218,516,516,314,515,110,424,118,815,417,614,6
201474,1418,917,714,915,010,212,418,816,221,420,419,720,118,418,417,017,914,226,622,621,024,426,439,4
201572,9217,916,814,114,29,611,617,515,019,818,818,118,316,616,515,015,612,122,118,216,117,316,317,1-1,6
2016117,2719,418,415,816,011,613,719,517,221,921,120,520,919,519,618,619,516,726,423,522,625,026,130,225,860,8
2017156,3819,918,916,516,712,514,620,118,022,521,821,321,720,420,619,720,718,227,124,724,026,327,530,928,246,433,4
2018186,0219,918,916,616,812,814,820,118,122,321,621,121,520,320,519,720,518,326,324,123,425,226,028,525,936,625,919,0
2019261,1320,619,717,517,613,815,820,919,023,222,522,122,621,521,721,121,920,027,525,625,227,028,030,428,637,630,629,240,4
2020499,8722,521,719,619,916,218,223,421,625,825,325,125,624,825,224,825,924,431,930,530,633,034,637,737,447,043,747,363,991,4
2021658,4622,822,020,020,316,718,723,722,126,125,625,426,025,225,625,226,324,931,930,630,732,834,337,036,644,341,243,252,458,831,7
2022407,9620,119,317,317,514,015,820,318,722,221,621,321,620,620,820,220,819,225,023,322,823,924,325,423,827,923,121,121,716,0-9,7-38,0
2023555,0520,619,817,918,114,816,520,919,322,822,221,922,221,421,521,021,720,225,724,223,824,925,326,425,128,924,923,524,420,73,6-8,236,1

Intuitive Surgical

Surgical Robots, $26 billion in revenue, 33,000 employees

The Da Vinci system for minimally invasive surgery with robotic arms is used about 5,000 times worldwide, roughly two-thirds of which are in the US. It was the first system of its kind approved by the FDA. There is now one competitor, although it is small. In the US, 3/4 of all prostate surgeries are performed with Da Vinci.
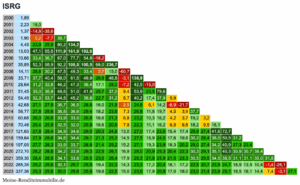
ISRG

ISRG over 23 years - from Dec 2000 until Dec 2023.

20001,89
20012,2318,0
20021,37-14,9-38,6
20031,900,2-7,738,7
20044,4523,925,980,2134,2
200513,0347,155,5111,9161,9192,8
200610,6633,436,767,077,754,8-18,2
200735,8952,358,992,2108,5100,566,0236,7
200814,1128,630,247,549,333,42,715,0-60,7
200933,7137,740,458,061,549,926,846,8-3,1138,9
201028,6431,232,846,247,336,417,128,0-7,242,5-15,0
201151,4535,036,949,651,041,925,737,09,453,923,579,6
201254,4932,333,744,545,236,822,731,28,740,217,437,95,9
201342,6827,127,936,736,528,616,021,92,924,86,114,2-8,9-21,7
201458,7727,828,636,836,629,418,223,87,326,811,819,74,53,937,7
201560,6826,026,633,933,526,816,621,36,823,210,316,24,23,719,23,2
201670,4625,425,932,532,025,916,620,87,822,311,116,26,56,618,29,516,1
2017121,6527,828,434,934,629,020,524,813,027,017,423,015,417,429,927,441,672,7
2018159,6427,928,634,634,429,121,325,314,527,518,924,017,619,630,228,438,050,531,2
2019197,0527,728,333,933,728,821,425,215,227,119,323,918,320,229,027,434,240,927,323,4
2020272,7028,228,834,233,929,322,526,116,928,020,925,320,422,330,329,135,140,330,930,738,4
2021359,3028,428,934,133,829,523,026,417,928,321,825,921,523,330,529,534,538,531,131,135,031,8
2022265,3525,225,630,129,725,519,422,314,323,317,220,416,117,222,520,723,524,716,913,510,4-1,4-26,1
2023337,3625,325,630,029,625,619,822,515,023,617,920,917,018,023,021,423,925,118,516,114,47,4-3,127,1

Intuit

Standard Software, $16 billion in revenue, 19,000 employees

Intuit is the maker of online banking and accounting software Quickbooks and Quicken. The German versions, “Finanzmanager” and “büro easy plus,” are distributed by Lexware. The popular marketing automation platform Mailchimp also belongs to Intuit.
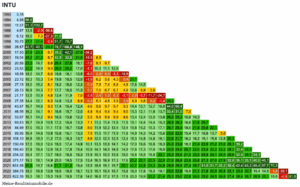
INTU

INTU over 30 years - from Dec 1993 until Dec 2023.

19933,16
19944,9556,6
199511,5791,3133,7
19964,6713,9-2,9-59,6
19976,1218,07,3-27,331,0
199810,7527,721,4-2,451,775,7
199926,6742,740,123,278,7108,8148,1
200017,5527,823,58,739,242,127,8-34,2
200119,0425,221,28,732,532,821,0-15,58,5
200220,8823,319,78,828,427,818,1-7,89,19,7
200323,5222,218,99,326,025,217,0-3,110,311,112,6
200419,5818,014,76,019,618,110,5-6,02,80,9-3,2-16,8
200523,7218,315,37,419,818,512,0-1,96,25,64,30,421,1
200627,1518,015,28,119,218,012,30,37,57,46,84,917,814,5
200728,1316,914,37,717,716,511,30,77,06,76,14,612,88,93,6
200821,1713,510,94,813,411,97,0-2,52,41,50,2-2,12,0-3,7-11,7-24,7
200927,3514,412,16,314,613,38,90,35,14,63,92,56,93,60,2-1,429,2
201043,8716,714,69,317,416,412,44,69,69,79,79,314,413,112,716,044,060,4
201146,9516,214,19,116,615,712,04,89,49,49,49,013,312,111,613,730,431,07,0
201253,6716,114,29,416,515,612,25,59,89,99,99,613,412,412,013,826,225,210,614,3
201369,6316,714,910,517,216,413,37,111,211,411,611,515,114,414,416,326,926,316,621,829,7
201484,9917,015,311,117,516,713,88,011,912,212,412,415,815,215,317,126,125,518,021,925,822,1
201589,9616,414,810,816,816,113,37,911,511,711,911,814,914,314,215,623,022,015,417,718,813,75,8
2016108,1016,615,011,217,016,313,78,612,012,312,512,415,314,814,816,122,621,716,218,219,115,812,820,2
2017150,4917,516,012,418,017,414,910,113,513,814,114,217,016,616,818,324,323,819,321,422,921,221,029,339,2
2018189,4017,816,412,918,317,815,410,914,114,514,814,917,617,317,618,924,524,020,122,023,422,222,228,232,425,9
2019254,0218,417,113,719,018,516,311,915,115,515,816,018,618,518,820,125,325,021,523,524,924,124,529,632,929,934,1
2020371,1719,318,114,920,019,517,513,416,516,917,317,620,220,120,522,027,026,823,825,827,327,027,932,836,135,140,046,1
2021631,9820,819,716,621,721,319,415,518,619,119,720,122,722,823,324,929,929,927,429,731,531,733,238,442,443,249,457,770,3
2022384,7518,016,813,918,518,016,112,315,115,415,715,818,017,818,019,123,022,619,821,121,820,920,823,123,620,719,414,81,8-39,1
2023622,3619,318,115,319,919,517,614,016,817,217,517,820,019,920,221,425,325,022,624,025,024,524,827,428,426,726,925,118,8-0,861,8

KKR & Co. ⭐

Investment Company, $14.5 billion in revenue, 4,500 employees

KKR, formerly known as “Kohlberg Kravis Roberts & Co,” does not only invest in tech. The illustrious, current or former portfolio also includes Hertha BSC. KKR was also a stakeholder in the Springer publishing house but recently divested, taking the non-journalistic business units, while Bild, Welt & Co. stayed with Springer.
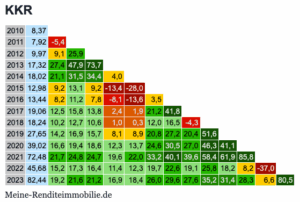
KKR

KKR over 13 years - from Dec 2010 until Dec 2023.

20108,37
20117,92-5,4
20129,979,125,9
201317,3227,447,973,7
201418,0221,131,534,44,0
201512,989,213,19,2-13,4-28,0
201613,448,211,27,8-8,1-13,63,5
201719,0612,515,813,82,41,921,241,8
201818,2410,212,710,61,00,312,016,5-4,3
201927,6514,216,915,78,18,920,827,220,451,6
202039,0216,619,418,612,313,724,630,527,046,341,1
202172,4821,724,824,719,622,033,240,139,658,461,985,8
202245,6815,217,316,411,412,319,722,619,125,818,28,2-37,0
202382,4419,221,621,216,918,426,029,627,635,231,428,36,680,5

KLA Corporation

Semiconductor Equipment, $10.5 billion in revenue, 15,000 employees

Formerly known as “KLA-Tencor” until 2019. Competitor of Applied Materials and Lam Research.
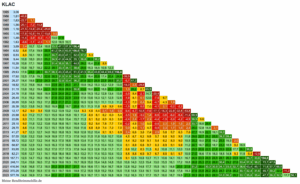
KLAC

KLAC over 38 years - from Dec 1985 until Dec 2023.

19853,06
19861,81-40,8
19871,83-22,71,1
19881,56-20,1-7,2-14,8
19891,16-21,5-13,8-20,4-25,6
19901,16-17,6-10,5-14,1-13,80,0
19911,48-11,4-3,9-5,2-1,713,027,6
19921,63-8,6-1,7-2,31,112,018,510,1
19933,692,410,712,418,833,547,157,9126,4
19946,528,817,419,926,941,254,063,9100,076,7
19956,938,516,118,123,734,743,047,162,037,06,3
19969,4410,818,020,025,234,941,844,955,136,820,336,2
199710,2810,617,118,823,331,436,638,144,529,216,421,88,9
199811,5410,816,718,222,229,133,334,138,625,615,318,510,612,3
199929,6317,624,026,130,738,343,345,451,341,535,443,846,469,8156,8
200017,9212,517,819,222,628,331,531,934,925,318,420,917,420,424,6-39,5
200126,3714,419,621,024,329,732,833,436,227,922,124,922,826,631,7-5,747,2
200218,8211,315,816,819,523,926,126,027,719,814,215,312,212,913,0-14,02,5-28,6
200331,1513,818,219,422,126,528,828,930,823,819,020,718,620,322,01,320,28,765,5
200424,7811,615,616,618,922,624,424,225,518,914,315,212,813,413,6-3,58,4-2,114,7-20,4
200526,4511,415,216,018,121,623,222,923,917,813,614,312,112,512,6-1,98,10,112,0-7,96,7
200626,9510,914,515,217,220,321,721,322,216,512,613,111,111,311,2-1,37,00,49,4-4,74,31,9
200726,3610,313,614,316,018,920,219,720,415,111,311,89,89,99,6-1,55,70,07,0-4,12,1-0,2-2,2
200812,176,29,09,410,813,213,913,213,48,34,64,42,11,50,5-9,4-4,7-10,5-7,0-17,1-16,3-22,8-32,8-53,8
200920,688,311,211,713,115,516,415,816,111,48,08,16,26,05,4-3,51,6-3,01,4-6,6-3,6-6,0-8,4-11,469,9
201022,668,311,111,612,915,216,015,415,711,38,18,26,56,35,8-2,42,4-1,72,3-4,4-1,5-3,0-4,2-4,936,59,6
201129,109,011,812,213,615,816,616,116,412,29,29,47,87,77,4-0,24,51,05,0-0,82,31,61,52,533,718,628,4
201229,708,811,411,813,115,115,915,415,611,68,88,97,47,37,00,04,31,14,7-0,52,31,71,62,425,012,814,52,1
201341,279,712,312,714,016,016,816,316,612,810,210,49,19,18,92,46,63,87,42,95,85,76,37,827,718,922,119,139,0
201457,5510,613,213,614,916,917,717,317,614,011,511,810,610,710,64,58,76,29,85,78,89,09,911,829,622,726,225,539,239,4
201558,7210,312,713,214,416,317,016,616,913,411,011,310,110,210,04,48,25,99,15,48,28,39,010,525,219,021,019,225,519,32,0
201668,6710,612,913,314,516,317,016,616,913,611,311,510,410,510,45,18,86,69,76,38,99,19,811,224,118,720,318,723,318,59,216,9
201793,9511,313,614,015,217,017,717,317,614,412,312,611,611,711,76,610,28,311,38,210,811,112,013,625,520,822,521,625,922,817,726,536,8
201882,2110,512,713,114,115,816,416,016,313,211,111,410,310,410,35,58,86,99,76,78,99,19,710,921,016,617,516,018,514,89,311,99,4-12,5
2019167,7112,514,715,216,318,018,718,418,715,813,914,213,313,513,69,112,510,813,711,113,614,115,116,726,923,324,924,528,126,323,930,034,733,6104,0
2020248,1113,415,616,017,218,919,619,319,716,915,015,414,614,815,010,614,012,515,413,015,516,117,218,828,625,327,026,930,429,227,633,437,938,273,747,9
2021416,9414,616,817,318,520,220,920,721,118,416,617,116,416,716,912,816,214,817,715,518,118,820,021,831,228,430,330,534,133,532,738,643,445,171,857,768,0
2022370,2513,815,916,417,519,119,719,519,817,215,515,915,215,415,511,614,813,416,113,916,216,817,819,327,624,826,226,028,727,626,230,132,431,645,730,222,2-11,2
2023577,7814,816,917,318,420,020,720,520,818,316,717,116,516,816,913,216,315,117,715,718,018,719,821,329,326,928,328,331,030,229,233,135,635,447,736,232,517,756,1

Lam Research

Semiconductor Equipment, $15 billion in revenue, 17,500 employees

Lam Research is a competitor of Applied Materials and KLA Corporation (formerly KLA-Tencor), two other stocks in our semiconductor-focused portfolio.
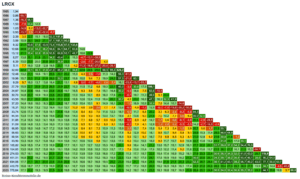
LRCX

LRCX over 38 years - from Dec 1985 until Dec 2023.

19851,94
19860,86-55,7
19871,36-16,358,1
19881,53-7,633,412,5
19891,03-14,66,2-13,0-32,7
19900,93-13,72,0-11,9-22,0-9,7
19912,393,522,715,116,052,3157,0
19923,9910,929,124,027,157,1107,166,9
19939,3221,740,637,843,573,4115,697,5133,6
199410,6820,937,034,238,259,684,164,763,614,6
199513,1221,135,432,835,952,869,853,148,718,622,8
19968,0713,825,121,923,134,243,427,619,3-4,7-13,1-38,5
19978,3913,023,020,020,830,036,923,316,0-2,6-7,7-20,04,0
19985,117,716,012,812,819,523,711,54,2-11,3-16,8-27,0-20,4-39,1
199932,0022,232,130,131,841,048,238,334,622,824,525,058,395,3526,2
200012,4813,221,118,619,125,529,720,215,34,32,6-1,011,514,256,3-61,0
200119,9815,723,321,221,928,032,223,719,610,09,47,319,924,257,5-21,060,1
20029,299,716,013,713,818,421,113,18,80,0-1,7-4,82,42,116,1-33,8-13,7-53,5
200327,7915,922,720,821,326,529,922,719,311,511,29,819,322,140,3-3,530,617,9199,1
200424,8714,420,618,619,023,626,519,716,59,38,87,415,116,830,2-4,918,87,663,6-10,5
200530,7014,820,718,919,323,626,320,017,010,410,18,916,017,629,2-0,719,711,349,05,123,4
200643,5516,021,720,020,424,627,221,318,612,612,411,518,420,130,74,523,216,947,116,232,341,9
200737,2014,419,618,018,322,124,218,716,010,410,19,114,916,124,71,916,910,932,07,614,410,1-14,6
200818,3110,314,913,213,216,418,012,710,04,63,92,67,17,413,6-6,04,9-1,212,0-8,0-7,4-15,8-35,2-50,8
200933,7412,617,315,715,919,120,815,813,48,48,07,011,612,318,70,511,76,820,23,36,32,4-8,2-4,884,3
201044,5513,417,916,416,619,621,316,614,39,69,38,513,013,719,83,113,69,321,67,010,27,70,66,256,032,0
201131,8511,415,514,014,116,918,313,811,67,16,65,79,610,015,10,08,94,814,71,73,60,6-6,1-3,820,3-2,8-28,5
201231,0910,814,813,313,416,017,313,010,86,56,15,28,89,113,8-0,27,94,112,81,32,80,2-5,5-3,514,2-2,7-16,5-2,4
201346,8512,016,014,614,717,218,614,512,48,48,17,310,911,315,92,810,77,415,85,47,35,41,03,920,78,61,721,350,7
201468,6313,116,915,615,818,319,615,713,810,09,79,112,613,217,65,212,910,018,18,610,79,45,89,124,615,311,429,248,646,5
201569,5412,716,415,115,217,618,815,113,29,69,38,712,012,516,65,012,19,316,77,99,88,55,38,121,012,89,321,630,821,81,3
201693,9613,316,915,715,818,219,415,814,110,610,49,813,113,617,66,513,410,918,09,811,710,78,010,822,715,813,224,231,926,117,035,1
2017165,8214,918,517,417,519,921,217,716,112,712,712,215,516,120,19,616,414,121,213,615,715,112,916,127,722,020,731,739,837,234,254,476,5
2018124,8513,516,815,715,818,019,115,814,210,910,810,313,313,717,37,413,611,417,610,512,211,49,211,621,215,613,721,526,121,716,121,515,3-24,7
2019274,5315,719,118,018,220,521,718,517,013,913,913,516,617,220,911,317,715,722,015,417,416,915,218,127,923,322,430,936,534,332,041,043,028,7119,9
2020451,5116,820,219,219,521,722,919,818,415,515,515,218,318,922,613,419,717,824,117,819,919,618,221,230,626,626,134,339,738,236,945,448,139,690,264,5
2021694,0617,721,120,120,422,623,820,819,516,616,716,519,520,223,815,021,119,425,519,621,621,520,323,232,328,728,436,141,240,139,246,749,243,077,159,053,7
2022410,7915,618,717,717,919,921,018,116,713,913,913,616,316,820,111,717,215,520,915,216,916,515,117,424,921,220,326,229,427,325,128,927,919,934,714,4-4,6-40,8
2023775,6417,120,219,319,521,522,619,818,515,915,915,718,419,022,314,219,718,123,518,119,819,718,520,928,425,124,630,534,032,430,935,235,229,344,129,619,85,788,8

LVMH

Luxury Goods, $79 billion in revenue, 196,000 employees

Price in EUR. MOH.BE = LVMH on the Berlin Stock Exchange

Another luxury goods company in our portfolio, alongside Hermès and Dior. LVMH is slightly less high-performing than Hermès but larger.

Note: Increased effort due to French withholding tax.
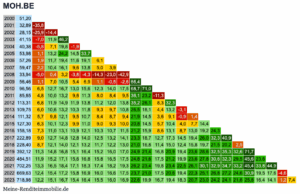
MOH.BE

MOH.BE over 23 years - from Dec 2000 until Dec 2023.

200051,20
200132,89-35,8
200228,15-25,9-14,4
200341,15-7,011,946,2
200440,38-5,87,119,8-1,9
200553,981,113,224,214,533,7
200657,261,911,719,411,619,16,1
200759,472,210,416,19,613,85,03,9
200833,94-5,00,43,2-3,8-4,3-14,3-23,0-42,9
200956,461,17,010,55,46,91,1-0,5-2,666,4
201096,566,512,716,713,015,612,314,017,568,771,0
201185,654,810,013,29,611,38,08,49,536,123,2-11,3
2012113,316,811,914,911,913,811,212,013,835,226,18,332,3
2013109,756,010,613,210,311,89,39,710,826,518,14,413,2-3,1
2014111,325,79,812,19,510,78,48,79,421,914,53,69,1-0,91,4
2015127,306,310,112,39,911,09,09,310,020,814,55,710,44,07,714,4
2016158,187,311,013,110,912,110,310,711,521,215,98,613,18,713,019,224,3
2017222,899,012,714,812,814,012,513,214,123,318,712,717,314,519,426,032,340,9
2018228,408,712,114,012,113,211,712,213,021,016,811,415,012,415,819,721,520,22,5
2019392,1211,314,816,815,116,415,216,017,024,921,416,820,919,423,628,632,535,332,671,7
2020484,5111,915,217,115,616,815,816,517,524,821,617,521,219,923,627,830,632,329,545,623,6
2021702,2513,316,518,417,118,317,418,219,326,223,419,823,422,526,130,132,934,733,245,433,844,9
2022669,6312,415,417,215,816,916,016,617,523,721,017,520,619,422,325,126,827,224,630,919,517,6-4,6
2023718,9812,215,116,715,416,415,516,016,922,619,916,719,418,320,723,024,224,121,625,816,414,11,27,4

McKesson

Pharmaceutical Distribution, $277 billion in revenue, 51,000 employees

The largest pharmaceutical distributor in the world in terms of revenue.
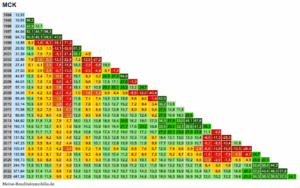
MCK

MCK over 29 years - from Dec 1994 until Dec 2023.

199412,51
199519,9159,2
199622,4333,912,7
199744,0452,148,796,3
199864,7250,848,169,947,0
199918,558,2-1,8-6,1-35,1-71,3
200029,9215,68,57,5-12,1-32,061,3
200131,3914,07,97,0-8,1-21,430,14,9
200222,867,82,00,3-12,3-22,97,2-12,6-27,2
200327,419,14,12,9-7,6-15,810,3-2,9-6,619,9
200427,038,03,52,4-6,7-13,57,8-2,5-4,98,7-1,4
200544,5712,28,47,90,1-5,215,78,39,224,927,564,9
200644,0111,17,57,00,0-4,713,16,67,017,817,127,6-1,3
200757,1012,49,28,92,6-1,415,19,710,520,120,128,313,229,7
200834,057,44,23,5-2,3-6,27,01,61,26,94,45,9-8,6-12,0-40,4
200955,4910,47,67,21,9-1,411,67,17,413,512,515,55,68,0-1,463,0
201063,1410,68,07,72,8-0,211,87,88,113,512,715,27,29,43,436,213,8
201170,5810,78,27,93,40,711,88,18,413,312,614,78,09,95,427,512,811,8
201288,6511,59,29,04,82,312,89,59,914,513,916,010,312,49,227,016,918,525,6
2013148,6213,911,811,87,95,716,013,113,818,618,420,916,219,017,334,327,933,045,167,6
2014192,1114,612,712,79,17,016,914,215,019,419,421,717,620,218,933,428,232,139,647,229,3
2015183,4313,611,711,78,26,315,412,813,417,417,219,015,217,215,727,222,123,827,027,411,1-4,5
2016131,5211,39,49,25,94,012,29,710,013,312,814,110,311,69,718,413,113,013,310,4-4,0-17,3-28,3
2017147,2311,39,59,46,24,412,29,810,113,212,813,910,511,69,917,713,012,913,010,7-0,2-8,5-10,411,9
2018105,419,37,57,34,22,59,67,27,410,09,410,26,87,65,712,07,46,65,92,9-6,6-13,9-16,9-10,5-28,4
2019133,589,98,38,15,23,510,48,28,410,910,411,28,28,97,313,29,28,78,36,0-1,8-7,0-7,60,5-4,726,7
2020169,7310,59,08,86,04,511,19,19,311,811,312,29,310,18,714,310,710,410,28,51,9-2,0-1,56,64,926,927,1
2021244,7911,610,110,07,46,012,410,510,813,312,913,811,212,111,016,413,213,113,211,96,43,54,913,213,632,435,444,2
2022371,6412,911,411,48,97,613,912,112,515,014,715,713,314,313,318,615,815,916,315,410,78,610,618,920,337,040,648,051,8
2023461,3413,211,911,99,58,214,312,613,015,415,216,113,914,813,919,016,316,516,916,212,010,212,219,621,034,336,339,637,324,1

Meta (Facebook)

Internet Services, $135 billion in revenue, 67,000 employees

Mark Zuckerberg is still young and seems to have gained stature recently, so Meta might still have a lot to offer.
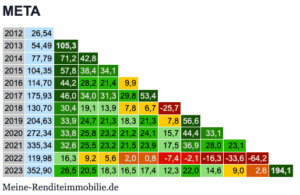
META

META over 11 years - from Dec 2012 until Dec 2023.

201226,54
201354,49105,3
201477,7971,242,8
2015104,3557,838,434,1
2016114,7044,228,221,49,9
2017175,9346,034,031,329,853,4
2018130,7030,419,113,97,86,7-25,7
2019204,6333,924,721,318,321,37,856,6
2020272,3433,825,823,221,224,115,744,433,1
2021335,3432,625,523,221,523,917,536,928,023,1
2022119,9816,39,25,62,00,8-7,4-2,1-16,3-33,6-64,2
2023352,9026,520,518,316,517,412,322,014,69,02,6194,1

Microsoft

Software, Hardware, Cloud Computing, $211 billion in revenue, 221,000 employees

In contrast to Apple, also strong in the B2B sector, including public sector. The transition to professional management also went smoothly.
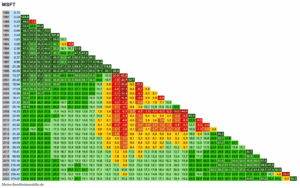
MSFT

MSFT over 37 years - from Dec 1986 until Dec 2023.

19860,10
19870,23124,9
19880,2348,6-1,8
19890,3753,426,663,4
19900,6458,040,568,173,0
19911,4369,157,584,495,9121,8
19921,6558,647,963,964,159,815,1
19931,5547,337,346,842,934,14,3-5,6
19942,3647,839,247,644,638,318,119,751,6
19953,3847,339,847,044,439,324,027,147,543,6
19966,3751,044,551,650,046,534,840,360,064,488,3
19979,9651,545,652,150,847,938,243,459,161,771,656,4
199821,3856,050,857,556,854,947,253,368,973,684,983,2114,6
199935,9956,952,258,457,956,449,755,468,872,580,678,190,168,4
200013,3741,536,640,438,535,428,229,936,033,631,620,410,3-20,9-62,8
200120,4242,337,741,339,636,930,532,338,036,134,926,219,7-1,5-24,752,7
200215,9437,032,635,433,530,624,525,529,527,024,816,59,9-7,1-23,89,2-22,0
200317,0335,030,833,331,428,622,923,727,124,622,415,19,3-4,5-17,18,4-8,76,8
200418,5833,429,431,729,827,121,822,425,322,920,814,39,3-2,3-12,48,6-3,18,09,1
200518,4131,427,529,527,625,020,020,422,920,618,512,58,0-2,1-10,66,6-2,64,94,0-0,9
200621,3230,526,928,726,924,419,720,122,320,218,212,88,80,0-7,28,10,97,57,87,115,8
200725,7630,126,528,226,524,219,820,122,220,218,413,510,02,1-4,19,83,910,110,911,518,320,8
200814,3325,121,723,021,218,814,514,516,013,811,77,03,4-3,9-9,70,9-4,9-1,8-3,4-6,3-8,0-18,0-44,4
200922,9926,523,224,622,920,716,716,818,316,414,710,47,20,7-4,46,21,55,45,14,45,72,5-5,560,5
201021,4924,921,823,021,319,215,315,316,714,813,19,16,10,0-4,64,90,63,83,42,53,20,2-5,922,5-6,5
201120,5223,620,521,620,017,914,314,215,413,611,98,15,3-0,3-4,64,00,02,82,41,41,8-0,8-5,512,7-5,5-4,5
201221,7122,819,920,919,317,313,813,814,913,111,68,05,30,1-3,84,10,63,12,72,02,40,3-3,410,9-1,90,55,8
201331,3323,620,821,820,318,415,115,116,214,613,29,87,42,6-1,06,83,66,36,36,06,95,73,316,98,013,423,644,3
201439,9723,721,022,020,618,815,615,616,715,213,910,78,54,00,78,15,38,08,18,09,08,26,518,611,716,824,935,727,6
201549,0423,721,122,020,618,915,915,917,015,614,311,39,35,02,09,06,59,09,29,210,39,78,419,213,517,924,331,225,122,7
201656,4323,420,921,820,418,815,815,916,915,514,311,59,65,52,79,47,09,59,79,710,710,29,118,713,717,522,427,021,718,815,1
201779,4123,921,522,421,119,516,716,817,816,515,412,810,97,24,511,08,911,311,611,813,012,711,921,016,820,525,329,626,225,727,340,7
201895,9323,821,422,321,119,616,916,917,916,715,713,111,47,85,311,69,511,912,212,413,513,412,720,917,220,624,628,125,124,525,130,420,8
2019151,1424,722,423,322,220,718,118,219,318,117,214,813,29,87,413,611,814,114,615,016,216,315,923,920,724,228,331,930,030,532,538,938,057,6
2020215,4325,223,023,922,821,418,919,020,019,018,115,814,311,18,914,913,215,616,116,617,818,017,725,322,625,929,933,231,732,434,439,839,549,942,5
2021328,4725,923,824,723,622,319,920,021,120,119,217,115,712,610,616,514,917,317,918,419,720,019,927,224,828,132,035,234,135,137,342,242,650,747,452,5
2022236,4224,021,922,721,620,317,918,018,917,917,014,913,510,58,513,912,414,414,915,216,216,215,922,219,622,124,927,025,224,925,227,024,425,316,14,8-28,0
2023374,0024,822,823,622,521,319,019,120,119,118,316,315,012,110,215,614,116,216,717,118,218,418,224,322,024,627,429,528,128,228,931,029,531,325,420,26,758,2

MSCI

Finance, $2.5 billion in revenue, 5,800 employees

This is not an “ETF on the MSCI World” but rather the MSCI company itself, which publishes the famous “MSCI World” and other indices.
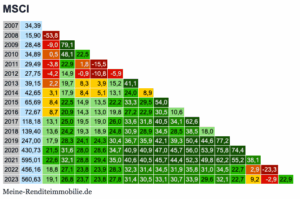
MSCI

MSCI over 16 years - from Dec 2007 until Dec 2023.

200734,39
200815,90-53,8
200928,48-9,079,1
201034,890,548,122,5
201129,49-3,822,91,8-15,5
201227,75-4,214,9-0,9-10,8-5,9
201339,152,219,78,33,915,241,1
201442,653,117,98,45,113,124,08,9
201565,698,422,514,913,522,233,329,554,0
201672,678,720,914,313,019,827,222,930,510,6
2017118,1813,125,019,519,026,033,631,840,534,162,6
2018139,4013,624,219,318,924,830,928,934,528,538,518,0
2019247,0017,928,324,124,330,436,735,942,139,350,444,677,2
2020430,7321,531,628,028,634,740,940,947,045,756,053,975,874,4
2021595,0122,632,128,829,435,040,640,545,744,452,349,862,255,238,1
2022456,1618,827,123,823,928,332,331,434,531,935,831,034,522,72,9-23,3
2023560,6319,126,823,723,827,831,430,533,130,733,929,632,122,79,2-2,922,9

Münchener Rück

Insurance, $58 billion in revenue, 42,000 employees

Price in EUR. MUV2.F = Munich Re on Frankfurt Stock Exchange

The largest reinsurer in the world. One of three German stocks on our list.
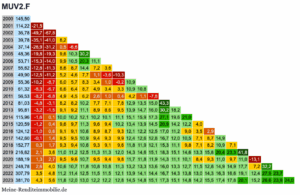
MUV2.F

MUV2.F over 23 years - from Dec 2000 until Dec 2023.

2000145,50
2001114,22-21,5
200236,78-49,7-67,8
200339,78-35,1-41,08,2
200437,14-28,9-31,20,5-6,6
200548,36-19,8-19,39,610,330,2
200653,71-15,3-14,09,910,520,311,1
200755,62-12,8-11,38,68,714,47,23,6
200849,90-12,5-11,25,24,67,71,1-3,6-10,3
200955,36-10,2-8,76,05,78,33,41,0-0,210,9
201061,32-8,3-6,76,66,48,74,93,43,310,910,8
201156,53-8,2-6,84,94,56,22,61,00,44,21,1-7,8
201281,03-4,8-3,18,28,210,27,77,17,812,913,515,043,3
201395,81-3,2-1,59,19,211,18,98,69,513,914,716,030,218,2
2014115,96-1,60,110,010,212,110,210,111,115,115,917,327,119,621,0
2015120,59-1,20,49,69,711,39,69,410,213,413,914,520,914,212,24,0
2016124,12-1,00,69,19,110,68,98,79,312,112,212,517,011,29,03,52,9
2017142,60-0,11,49,59,510,99,49,39,912,412,612,816,712,010,57,18,714,9
2018152,770,31,79,39,410,69,39,19,611,811,912,115,311,19,87,18,210,97,1
2019216,622,13,611,011,212,511,311,312,014,314,615,118,315,114,613,315,820,423,341,8
2020188,191,32,79,59,610,79,59,49,811,711,811,914,311,110,18,49,311,09,711,0-13,1
2021248,782,64,010,610,711,810,810,811,313,213,313,616,013,312,711,512,814,914,917,77,232,2
2022307,793,54,811,211,412,511,511,512,113,914,114,416,714,313,813,014,316,316,619,112,427,923,7
2023381,704,35,611,812,013,012,212,212,814,514,815,117,315,114,814,215,517,417,820,115,226,623,924,0

Netflix

Streaming Services, $33.7 billion in revenue, 13,000 employees

The streaming market is becoming increasingly fragmented; Amazon Prime and Disney are financially strong competitors, and Paramount+ joined in late 2022. The future could be challenging for Netflix.
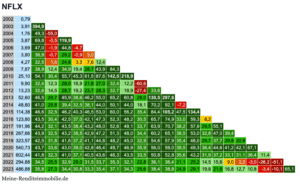
NFLX

NFLX over 21 years - from Dec 2002 until Dec 2023.

20020,79
20033,91394,9
20041,7649,3-55,0
20053,8769,8-0,5119,9
20063,6947,0-1,944,8-4,7
20073,8036,9-0,729,2-0,93,0
20084,2732,51,824,83,37,612,4
20097,8738,912,434,919,428,743,984,3
201025,1054,130,455,745,361,587,6142,5218,9
20119,9032,412,328,016,921,827,032,412,2-60,6
201213,2332,614,528,719,223,728,332,718,9-27,433,6
201352,6046,529,745,938,646,255,065,260,828,0130,5297,6
201448,8041,025,839,432,538,144,050,144,018,170,292,1-7,2
2015114,3846,632,546,240,346,553,060,056,235,484,4105,247,5134,4
2016123,8043,530,442,537,042,147,352,348,230,565,774,933,059,38,2
2017191,9644,232,143,538,443,248,052,649,133,763,970,738,257,929,555,1
2018267,6643,932,543,238,542,947,251,348,034,460,265,138,553,032,847,039,4
2019323,5742,531,841,637,241,144,848,245,032,954,657,935,446,029,737,729,820,9
2020540,7343,733,643,039,042,846,449,746,935,956,059,039,549,336,444,641,242,167,1
2021602,4441,832,341,037,140,543,646,343,533,550,852,835,643,231,937,233,131,136,411,4
2022294,8834,525,532,929,031,533,735,332,122,836,136,421,125,214,515,69,02,5-3,0-26,2-51,1
2023486,8835,827,334,430,833,335,437,134,325,638,438,824,929,119,821,616,812,710,8-3,4-10,165,1

Novo Nordisk

Pharma, $32 billion in revenue, 63,000 employees

A Danish pharmaceutical company and by far the most valuable European company, a major competitor of Eli Lilly, which has been even more high-performing than Novo Nordisk in recent years but also more volatile. Both companies are strong in insulin.

Like competitor Eli Lilly (“Mounjaro” or tirzepatide), Novo Nordisk offers a medication (“Ozempic” or semaglutide) that is suitable (also) for weight loss. The competitor Eli Lilly’s medication appears to be more effective at comparable side effects.
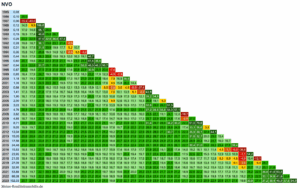
NVO

NVO over 38 years - from Dec 1985 until Dec 2023.

19850,08
19860,1025,0
19870,06-13,4-40,0
19880,1214,59,5100,0
19890,1517,014,558,125,0
19900,1918,917,446,825,826,7
19910,2823,222,947,032,636,647,4
19920,2819,618,736,123,623,121,40,0
19930,3118,417,531,520,919,917,75,210,7
19940,3015,814,725,816,514,912,12,33,5-3,2
19950,4418,617,928,320,419,618,312,016,319,146,7
19960,6020,119,629,222,321,921,116,521,024,641,436,4
19970,9422,822,631,725,725,825,722,427,432,046,346,256,7
19980,8720,219,827,521,921,620,917,620,822,930,525,520,4-7,4
19990,8518,417,924,719,518,918,114,917,218,323,217,912,3-4,9-2,3
20001,1819,719,325,821,020,620,017,319,721,025,621,818,47,916,538,8
20011,3519,318,924,920,520,119,517,019,120,224,020,517,69,515,826,014,4
20020,9815,915,320,516,215,514,612,113,313,615,912,18,50,83,04,9-8,9-27,4
20031,4117,316,821,817,917,416,714,415,816,418,815,713,07,010,113,56,12,243,9
20041,9018,117,822,518,818,417,915,917,317,920,317,615,510,613,917,512,612,139,234,8
20052,0017,517,121,518,017,617,015,116,316,818,816,314,39,912,615,311,110,326,819,15,3
20063,0318,918,622,919,619,318,917,218,519,221,319,217,613,916,919,917,017,532,629,026,351,5
20074,7620,420,224,421,421,220,919,420,821,523,721,920,717,620,824,022,023,437,235,535,854,357,1
20083,8218,318,021,918,918,618,116,617,718,219,918,116,713,615,918,215,816,025,522,119,124,112,3-19,7
20094,8518,718,422,119,319,018,617,218,318,820,418,717,414,716,919,017,017,325,722,920,624,817,00,927,0
20108,7120,620,524,221,521,321,119,821,021,723,422,021,118,721,223,622,123,031,429,728,934,230,222,351,079,6
20119,0519,919,723,220,720,520,219,020,120,622,220,819,817,619,721,820,321,028,026,225,028,624,517,433,336,63,9
201213,0420,820,624,021,621,421,220,121,221,823,322,121,219,221,323,422,222,929,528,027,230,727,522,335,939,122,444,1
201315,0520,620,423,721,321,220,919,920,921,422,921,720,918,920,922,821,622,328,226,725,928,725,721,131,632,720,029,015,4
201417,5620,420,323,421,121,020,819,720,721,222,621,420,618,820,722,421,321,827,225,824,927,324,620,528,929,319,224,716,016,7
201524,4821,020,923,921,821,621,520,521,522,023,322,321,619,921,723,422,423,028,126,926,228,526,122,730,431,023,028,223,427,539,4
201615,5318,518,321,119,018,718,517,418,218,619,618,517,715,917,418,617,517,721,820,319,120,517,814,019,218,110,111,44,51,1-6,0-36,6
201723,9519,519,322,120,019,919,618,719,519,921,019,919,217,619,120,419,419,723,722,421,523,020,717,522,622,115,517,612,912,310,9-1,154,2
201821,0518,418,220,818,818,618,317,418,118,419,418,317,616,017,318,417,417,521,119,718,719,817,514,518,617,711,712,88,36,94,6-4,916,4-12,1
201927,0918,718,521,019,118,918,717,718,518,819,718,718,016,517,818,917,918,121,620,319,420,518,415,619,518,813,414,711,010,39,12,620,46,428,7
202032,9518,818,621,119,219,018,817,918,618,919,818,818,216,718,019,018,118,321,620,419,520,518,616,019,719,014,215,412,311,811,16,120,711,225,121,6
202153,8819,819,722,120,320,220,019,219,920,221,220,319,718,419,620,820,020,223,522,421,722,921,218,922,622,218,019,517,117,317,414,128,222,536,841,063,5
202266,0819,919,822,220,420,320,119,320,020,321,220,419,818,519,820,820,120,423,422,421,822,821,219,222,622,318,419,817,617,918,015,227,322,533,134,641,622,6
2023102,3320,720,623,021,321,221,020,321,021,322,321,521,019,821,022,121,421,724,823,923,324,423,021,124,524,320,922,420,621,121,619,630,927,437,239,445,937,854,9

Nvidia 🏆

Microelectronics, $60 billion in revenue, 30,000 employees

Nvidia’s moat is considered very wide and deep, with a lead of 2-3 years over the competition. Nvidia’s cash war chest is brimming, making it harder for potential competitors. The 61-year-old founder still leads the company and appears to be in excellent health.

The only thing slowing Nvidia is its already enormous market cap of $3.5 trillion as of October 2024 and investor skepticism about whether a single company can take an even larger share of the total NYSE plus Nasdaq market cap than the six percent Nvidia currently represents.

Can Nvidia—or any company—grow to $5, $6 … $10, $12 trillion and overtake Apple and Microsoft? A relatively faceless company, previously known mainly to gamers and PC enthusiasts?

The numbers speak for Nvidia. The big tech giants plead with Nvidia’s CEO to move up on the waiting list for Nvidia’s new chip coming in 2025. They don’t just want it; they need Nvidia’s chip to advance their own AI narrative and avoid falling behind.

Nvidia is well-positioned for another stock explosion in 2025 and is our top pick among all stocks. A significant correction will undoubtedly occur again at some point (if only one knew when), but it is likely to rebound quickly afterward.
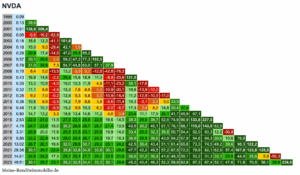
NVDA

NVDA over 24 years - from Dec 1999 until Dec 2023.

19990,09
20000,1339,6
20010,51138,8308,4
20020,09-0,6-16,2-82,8
20030,1818,612,3-41,1101,6
20040,1815,09,5-29,443,11,6
20050,2820,917,4-14,047,025,555,2
20060,5730,128,62,059,247,277,3102,5
20070,7831,029,97,354,744,863,067,137,9
20080,198,45,0-13,513,20,90,7-12,8-42,8-76,3
20090,4316,914,6-2,225,415,818,911,3-8,9-25,9131,5
20100,3513,310,9-4,019,010,311,94,8-11,1-23,238,1-17,6
20110,3211,18,8-4,615,37,68,52,2-10,9-20,119,8-13,9-10,0
20120,289,27,0-5,212,45,35,80,2-10,9-18,411,2-12,9-10,5-11,0
20130,3810,88,9-2,514,27,98,63,8-5,6-11,415,3-3,12,39,033,5
20140,4811,910,1-0,515,29,510,36,2-2,0-6,717,32,48,014,830,427,4
20150,8014,713,23,318,613,414,611,24,00,423,411,117,926,141,745,967,1
20162,6322,021,011,527,523,125,022,616,614,539,329,639,752,674,690,9133,8227,0
20174,7924,723,915,030,526,528,726,721,419,943,535,245,157,176,188,7115,0143,982,0
20183,3120,920,011,625,521,523,120,915,914,033,425,532,339,850,754,462,060,312,2-30,8
20195,8623,222,414,528,024,426,124,319,718,336,929,936,643,954,257,964,864,330,610,676,9
202013,0226,726,118,632,028,830,729,225,124,242,536,443,451,161,465,873,374,549,239,698,3122,2
202129,3630,129,722,435,832,834,933,830,129,647,742,249,557,267,572,379,982,162,057,4107,0123,9125,5
202214,6124,824,217,329,126,127,726,222,521,636,631,236,441,648,350,153,251,333,125,044,935,65,9-50,3
202349,5130,129,723,135,232,534,433,330,129,645,240,446,352,359,962,867,367,452,147,671,870,556,129,9239,0

Old Dominion Freight Line

Logistics, $5.8 billion in revenue, 23,000 employees

Truck transport and residential moves with over 250 locations in the US. Smaller trucks collect transport goods nationwide and bring them to locations where they are transported further at night in large trucks.
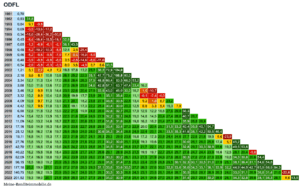
ODFL

ODFL over 32 years - from Dec 1991 until Dec 2023.

19910,70
19920,9331,8
19930,849,1-9,8
19940,69-0,5-13,6-17,2
19950,34-16,6-28,4-36,2-50,8
19960,45-8,4-16,4-18,5-19,132,8
19970,65-1,3-6,9-6,1-2,138,143,5
19980,48-5,2-10,2-10,3-8,512,43,5-25,4
19990,46-5,2-9,6-9,5-7,97,70,4-16,0-5,5
20000,40-5,9-9,8-9,8-8,63,5-2,8-14,6-8,6-11,6
20010,54-2,6-5,8-5,3-3,58,03,6-4,53,78,633,5
20021,215,12,74,27,219,817,813,225,738,272,9124,0
20032,189,98,110,013,626,125,222,335,147,775,2100,880,0
20043,3412,711,313,417,028,828,426,337,948,869,483,566,053,2
20053,8813,011,613,617,027,526,925,034,642,857,163,747,433,416,2
20063,4611,29,911,514,423,522,620,427,933,543,045,030,016,71,9-10,7
20073,3210,28,910,412,820,919,917,723,928,135,135,422,411,1-0,1-7,4-4,0
20084,0910,99,711,213,521,120,118,223,827,533,533,522,513,45,21,88,723,2
20094,4210,79,611,013,120,119,117,322,225,430,430,020,312,55,83,38,415,37,9
20106,9012,811,813,215,522,221,519,924,828,032,832,724,317,912,912,218,827,629,856,3
20118,7413,412,513,916,122,521,820,424,927,932,232,124,619,014,814,520,427,428,840,726,7
201211,0914,013,214,616,722,722,120,825,127,831,831,624,819,816,216,221,427,328,335,926,826,9
201317,1615,614,916,318,424,323,822,726,829,533,433,427,322,920,020,425,731,533,240,435,540,154,7
201425,1216,816,217,619,725,425,024,028,030,634,334,428,824,922,423,128,133,535,341,638,142,250,546,4
201519,1114,814,115,317,122,321,820,724,126,329,329,023,619,817,217,320,924,424,627,722,621,619,95,6-23,9
201627,7615,815,216,418,323,322,921,825,227,330,230,025,121,619,319,623,126,627,030,026,126,025,817,45,145,2
201742,7017,116,617,819,624,624,223,326,628,731,531,426,823,721,722,125,729,129,832,829,730,330,925,619,349,553,8
201840,2216,215,616,818,423,022,621,724,726,629,128,924,521,519,519,722,725,425,727,824,724,423,918,612,528,120,4-5,8
201962,0917,416,918,019,724,223,923,026,027,830,330,226,123,321,521,924,927,628,030,327,627,827,923,919,834,330,820,654,4
202096,1518,518,019,220,925,325,024,327,229,031,531,427,525,023,423,926,829,530,132,330,130,531,027,925,138,136,431,154,654,8
2021177,1820,219,921,122,827,227,026,329,331,133,633,630,027,726,327,030,032,833,636,034,335,136,133,932,244,944,942,763,968,984,3
2022140,7518,618,219,320,925,024,724,026,728,330,530,326,824,523,123,526,128,428,730,528,628,728,926,324,033,031,126,936,831,421,0-20,6
2023201,9219,319,020,121,625,625,324,727,328,931,030,927,625,424,124,627,029,329,731,429,729,930,228,026,134,332,829,638,134,328,16,843,5

Palo Alto Networks ⭐

IT Security (Cybersecurity), $8 billion in revenue, 15,000 employees

Palo Alto Networks acquires one to four companies per year and serves 85 of the Fortune 100 companies. The use of AI is also open to attackers, so Palo Alto should have plenty of work in the future. Competitor Fortinet is also on this stock list.
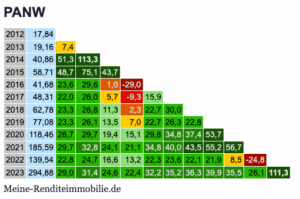
PANW

PANW over 11 years - from Dec 2012 until Dec 2023.

201217,84
201319,167,4
201440,8651,3113,3
201558,7148,775,143,7
201641,6823,629,61,0-29,0
201748,3122,026,05,7-9,315,9
201862,7823,326,811,32,322,730,0
201977,0823,326,113,57,022,726,322,8
2020118,4626,729,719,415,129,834,837,453,7
2021185,5929,732,824,121,134,840,043,555,256,7
2022139,5422,824,716,613,222,323,622,121,98,5-24,8
2023294,8829,031,424,622,432,235,236,339,935,526,1111,3

Quanta Services ⭐

Infrastructure Services, $30 billion in revenue, 40,000 employees

Quanta Services designs, builds, and maintains networks of all kinds: electricity, oil, gas, and telecommunications. Our favorite, alongside United Rentals, for highly profitable non-tech stocks.
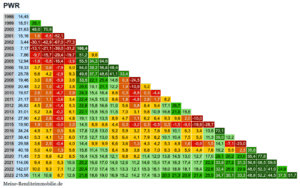
PWR

PWR over 25 years - from Dec 1998 until Dec 2023.

199814,45
199918,5128,1
200031,6348,070,9
200115,161,6-9,5-52,1
20023,44-30,1-42,9-67,0-77,3
20037,17-13,1-21,1-39,0-31,2108,4
20047,86-9,7-15,7-29,4-19,751,29,6
200512,94-1,6-5,8-16,4-3,955,534,364,6
200619,333,70,6-7,95,054,039,256,849,4
200725,786,64,2-2,99,349,637,748,641,133,4
200819,463,00,6-5,93,633,522,125,414,60,3-24,5
200920,483,21,0-4,73,829,019,121,112,21,9-10,95,2
201019,572,60,5-4,72,924,315,416,48,60,3-8,80,3-4,4
201121,173,01,1-3,63,422,414,515,28,61,8-4,82,81,78,2
201226,824,52,9-1,45,322,815,816,611,05,60,88,49,417,126,7
201331,015,23,8-0,26,122,115,816,511,57,03,19,810,916,621,015,6
201427,904,22,8-0,94,819,113,113,58,94,71,16,26,49,39,62,0-10,0
201519,901,90,5-3,02,014,58,98,84,40,3-3,20,3-0,50,3-1,5-9,5-19,9-28,7
201634,244,93,70,55,617,812,813,09,25,93,27,37,69,810,16,33,410,872,1
201738,435,34,11,26,017,512,713,09,56,44,17,98,210,110,47,55,511,339,012,2
201829,583,62,5-0,44,014,49,99,96,63,61,34,34,25,34,91,6-0,91,514,1-7,1-23,0
201940,185,04,01,35,615,611,411,58,45,83,86,87,08,38,35,94,47,619,25,52,335,8
202071,457,56,64,28,518,414,514,812,19,88,211,412,013,814,513,012,717,029,120,223,055,477,8
2021114,069,48,66,310,620,216,617,014,612,611,214,615,417,418,317,417,722,333,827,231,356,868,559,6
2022142,0710,09,37,111,220,417,017,415,113,312,115,316,118,018,918,118,422,632,426,829,948,052,341,024,6
2023215,5611,410,88,712,821,818,619,016,915,214,217,418,320,321,320,921,425,534,730,133,348,852,244,537,551,7

RadNet

Outpatient Radiology, $1.5 billion in revenue, 7,100 employees

RadNet is the largest provider of outpatient radiology services in the US.
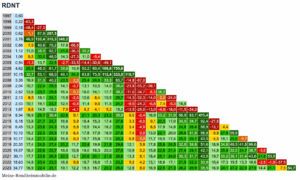
RDNT

RDNT over 26 years - from Dec 1997 until Dec 2023.

19970,60
19980,22-63,3
19990,16-48,4-27,3
20000,621,167,9287,5
20012,7646,5132,4315,3345,2
20020,867,540,675,217,8-68,8
20031,1211,038,562,721,8-36,330,2
20041,068,530,046,014,3-27,311,0-5,4
20050,54-1,313,722,5-2,7-33,5-14,4-30,6-49,1
20064,6225,546,361,739,810,952,260,4108,8755,6
200710,1532,753,168,049,124,263,873,5112,4333,5119,7
20083,3516,931,340,223,52,825,424,533,383,7-14,8-67,0
20092,0410,722,429,014,1-3,713,110,514,039,4-23,9-55,2-39,1
20102,8212,623,729,816,40,216,014,117,739,2-11,6-34,7-8,338,2
20112,139,519,124,111,9-2,610,68,410,525,7-14,3-32,3-14,02,2-24,5
20122,5310,119,123,712,4-0,811,49,511,524,7-9,5-24,3-6,87,4-5,318,8
20131,676,614,518,27,9-4,16,24,15,215,2-13,5-26,0-13,0-4,9-16,0-11,5-34,0
20148,5416,925,730,420,69,121,120,323,235,98,0-2,416,933,231,958,983,7411,4
20156,1813,821,725,716,65,916,415,317,427,63,3-6,09,120,317,030,534,792,4-27,6
20166,4513,320,624,315,85,815,514,416,225,33,4-4,98,517,914,824,826,456,9-13,14,4
201710,1015,222,325,917,88,417,817,018,927,67,40,013,022,120,029,631,956,85,827,856,6
201810,1714,421,124,416,88,016,715,817,525,36,80,011,719,517,425,026,143,54,518,125,60,7
201920,3017,424,027,420,211,720,419,921,829,612,15,917,825,824,532,634,651,618,934,646,541,899,6
202019,5716,422,625,718,810,919,018,320,027,010,95,215,822,821,427,929,142,114,825,932,024,738,7-3,6
202130,1117,723,826,920,312,720,620,121,828,613,38,118,425,124,030,331,743,519,730,236,131,443,621,853,9
202218,8314,820,423,016,89,616,716,017,323,29,24,213,118,617,121,922,230,910,417,319,513,316,6-2,5-1,9-37,5
202334,7716,922,425,119,112,219,318,720,226,012,68,016,922,521,326,226,935,516,924,127,222,927,914,421,17,584,7

Rheinmetall

Defense, $7 billion in revenue, 28,000 employees

Price in EUR. RHM.F = Rheinmetall on the Frankfurt Stock Exchange

If you have ethical concerns, simply skip Rheinmetall. Even before the Ukraine war, Rheinmetall had been performing well for years, with annualized returns (also known as “internal rate of return”) of over 20 percent per year. One of three German stocks in our selection; the others are Sartorius Pref. and Munich Re.
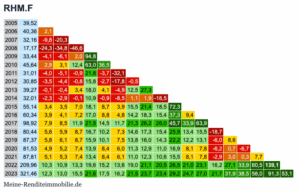
RHM.F

RHM.F over 18 years - from Dec 2005 until Dec 2023.

200539,52
200640,362,1
200732,16-9,8-20,3
200817,17-24,3-34,8-46,6
200933,44-4,1-6,12,094,8
201045,642,93,112,463,036,5
201131,01-4,0-5,1-0,921,8-3,7-32,1
201230,85-3,5-4,4-0,815,8-2,7-17,8-0,5
201339,27-0,1-0,43,418,04,1-4,912,527,3
201432,01-2,3-2,9-0,110,9-0,9-8,51,11,9-18,5
201555,143,43,57,018,18,73,915,521,418,572,3
201660,343,94,17,217,08,84,814,218,315,437,39,4
201798,927,98,511,921,514,511,721,326,226,045,733,963,9
201880,445,65,98,716,710,27,314,617,315,425,913,415,5-18,7
201987,375,86,18,715,910,17,513,816,014,322,212,213,1-6,08,6
202081,534,95,27,413,98,46,011,312,911,016,98,17,8-6,20,7-6,7
202187,815,15,37,413,48,46,111,012,310,615,58,17,8-2,93,00,37,7
2022209,9610,310,913,319,615,213,619,021,120,526,521,023,116,227,133,960,5139,1
2023321,4612,313,015,521,617,516,221,523,723,429,224,727,021,731,938,558,091,353,1

Sartorius Pref.

Laboratory Technology, $3.4 billion in revenue, 14,600 employees

Price in EUR. SRT3.DE = Sartorius Pref. on German exchanges

Sartorius (here the pref. = preferred, not common shares) supplies accessories for biopharma, and its share price seems, as of October 2024, affordable after peaking during COVID. One of three German stocks here.

Sartorius has recently declined more than any other stock on this list. Against our principle of selecting strong-performing stocks, we present Sartorius here as a possible exception that might see significant growth in the foreseeable future, although it is uncertain when that may be. If the sideways trend lasts too long, the average return over the next decade could again be modest, even if the eventual increase is steep.

SRT3.DE

SRT3.DE over 24 years - from Dec 1999 until Dec 2023.

19990,97
20001,3842,3
20011,2814,9-7,2
20020,63-13,4-32,4-50,8
20031,358,6-0,72,7114,3
20042,8724,220,130,9113,4112,6
20054,2427,925,234,988,877,247,7
20067,1132,931,440,983,374,057,467,7
20074,7522,019,324,449,837,018,35,8-33,2
20081,525,11,22,515,82,4-14,7-29,0-53,8-68,0
20093,7314,411,714,328,918,55,4-3,2-19,3-11,4145,4
20106,0818,216,018,932,824,013,37,5-3,88,6100,063,0
20118,5819,918,121,033,726,016,912,53,815,978,151,741,1
201217,6425,023,726,939,533,125,522,616,430,084,667,970,3105,6
201323,2825,524,327,338,832,926,223,718,530,372,658,156,464,732,0
201427,1124,923,726,536,831,425,222,918,228,361,648,745,346,724,016,5
201557,0629,028,231,241,436,631,229,726,036,467,957,656,560,647,956,6110,5
201663,0827,827,029,739,034,429,427,824,433,359,349,847,749,037,539,452,510,6
201793,9428,928,230,839,635,430,829,526,434,858,149,747,949,039,741,751,328,348,9
2018128,8629,328,731,239,535,531,230,027,335,055,948,246,547,339,340,847,731,242,937,2
2019208,1630,830,232,740,737,033,132,129,737,056,449,548,149,042,344,150,338,248,948,961,5
2020406,3333,332,935,443,239,936,335,633,540,859,353,252,253,548,050,557,048,159,362,977,695,2
2021471,9232,532,034,441,738,535,034,232,338,955,549,748,549,344,145,750,442,249,649,754,150,616,1
2022408,0130,029,531,638,235,131,730,828,834,649,143,542,042,136,937,540,332,436,534,133,425,10,2-13,5
2023340,2227,727,128,934,931,828,627,625,630,643,438,036,335,930,930,832,525,027,223,921,413,1-5,7-15,1-16,6

ServiceNow

Cloud Computing, $7.2 billion in revenue, 20,500 employees

ServiceNow, led by the former head of Germany’s largest software company, SAP, acquires two to four companies per year. Its platform-as-a-service product portfolio is extensive and difficult to summarize. The main product is “IT Service Management.” A partnership with Nvidia was established in 2023.
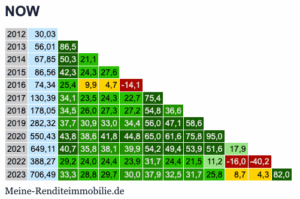
NOW

NOW over 11 years - from Dec 2012 until Dec 2023.

201230,03
201356,0186,5
201467,8550,321,1
201586,5642,324,327,6
201674,3425,49,94,7-14,1
2017130,3934,123,524,322,775,4
2018178,0534,526,027,327,254,836,6
2019282,3237,730,933,034,456,047,158,6
2020550,4343,838,641,844,865,061,675,895,0
2021649,1140,735,838,139,954,249,453,951,617,9
2022388,2729,224,024,423,931,724,421,511,2-16,0-40,2
2023706,4933,328,829,730,037,932,531,725,88,74,382,0

Synopsys

Semiconductor Design and Software, $5.5 billion in revenue, 20,000 employees

Competitor of Cadence Design Systems. Cadence grows more organically, while Synopsys grows more through acquisitions.
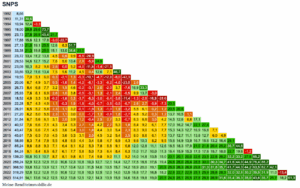
SNPS

SNPS over 31 years - from Dec 1992 until Dec 2023.

19928,66
199311,3130,6
199410,9412,4-3,3
199519,0029,929,673,7
199623,1327,826,945,421,7
199717,8815,612,117,8-3,0-22,7
199827,1321,019,125,512,68,351,7
199933,3821,319,825,015,113,036,623,0
200023,7213,411,213,84,50,69,9-6,5-28,9
200129,5314,612,715,27,65,013,42,9-5,924,5
200223,0810,38,29,82,80,05,2-4,0-11,6-1,4-21,8
200333,8613,211,613,47,55,611,24,50,412,67,146,7
200419,557,05,16,00,3-2,11,3-5,3-10,1-4,7-12,8-8,0-42,3
200520,066,74,95,70,5-1,61,4-4,2-8,1-3,3-9,2-4,6-23,02,6
200626,738,46,87,73,21,54,6-0,2-3,12,0-2,03,7-7,616,933,3
200725,937,66,16,92,61,03,8-0,5-3,11,3-2,12,4-6,59,913,7-3,0
200818,524,93,33,8-0,2-1,80,3-3,7-6,3-3,0-6,4-3,6-11,4-1,3-2,6-16,8-28,6
200922,285,74,34,91,1-0,31,9-1,8-4,0-0,7-3,5-0,5-6,72,62,7-5,9-7,320,3
201026,916,55,25,82,31,13,2-0,1-1,91,3-1,01,9-3,25,56,10,21,220,520,8
201127,206,25,05,52,31,13,00,0-1,71,3-0,81,8-2,74,85,20,31,213,710,51,1
201231,846,75,66,13,12,03,91,2-0,42,50,73,3-0,76,36,83,04,214,512,68,817,1
201340,577,66,67,14,33,45,32,71,44,22,75,31,88,49,26,17,717,016,214,722,127,4
201443,477,66,67,14,53,65,43,01,84,43,05,42,38,39,06,37,715,314,312,716,916,87,1
201545,617,56,57,04,53,65,33,12,04,53,25,42,58,08,66,17,313,712,711,113,812,76,04,9
201658,868,37,47,95,54,86,54,43,45,84,76,94,39,610,38,29,515,614,913,916,716,613,216,429,1
201785,249,68,89,37,16,48,16,25,37,86,89,16,812,012,811,112,618,518,317,921,021,820,425,236,744,8
201884,249,18,48,96,76,17,75,85,07,36,48,46,311,011,710,011,316,415,915,317,517,615,718,022,719,6-1,2
2019139,2010,810,110,78,78,19,88,17,49,89,011,19,214,014,813,515,020,120,120,022,623,522,826,232,233,227,865,2
2020259,2412,912,312,911,010,612,310,810,312,712,114,412,717,518,617,619,424,625,025,428,530,030,334,741,644,944,975,486,2
2021368,5013,813,213,912,111,713,412,011,514,013,515,714,218,920,019,120,925,926,326,929,831,331,835,741,744,344,263,562,742,1
2022319,2912,812,212,811,010,612,210,810,312,512,014,012,516,817,716,818,222,622,722,925,125,925,828,332,032,630,239,531,911,0-13,4
2023514,9114,113,614,212,512,213,812,512,114,313,915,914,618,819,819,020,524,825,125,527,828,828,931,635,436,335,043,638,725,718,261,3

Tesla with Question Marks

Automotive, $97 billion in revenue, 140,000 employees

Regardless of one’s opinion on Elon Musk’s public statements, he undoubtedly generates massive free publicity for Tesla and is, economically speaking, still an asset for Tesla. A highly volatile share price that has been sideways since the end of 2022, with potential for further growth.

The latest product launches were not convincing. On the other hand, Tesla is full of surprises and currently represents only about four percent of the global automotive industry’s total revenue; so there is room for growth.

Still, for us, it’s a stock to watch rather than buy. Included on this list as a member of the “Magnificent 7,” some of which are already referred to as the “Magnificent 6” due to Tesla’s poor performance.
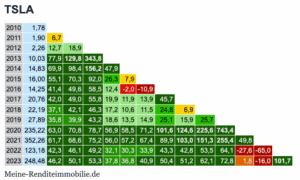
TSLA

TSLA over 13 years - from Dec 2010 until Dec 2023.

20101,78
20111,906,7
20122,2612,718,9
201310,0377,9129,8343,8
201414,8369,998,4156,247,9
201516,0055,170,392,026,37,9
201614,2541,449,658,512,4-2,0-10,9
201720,7642,049,055,819,911,913,945,7
201822,1937,142,146,317,210,611,524,86,9
201927,8935,839,943,218,613,514,925,115,925,7
2020235,2263,070,878,756,958,571,2101,6124,6225,6743,4
2021352,2661,768,675,256,057,267,489,9103,0151,3255,449,8
2022123,1842,346,149,232,130,333,943,342,853,564,1-27,6-65,0
2023248,4846,250,153,337,836,840,950,451,262,172,81,8-16,0101,7

Tractor Supply Company

Retail, $14 billion in revenue, 25,000 employees

Retail for agriculture and livestock with over 2,000 locations in rural areas of the US.
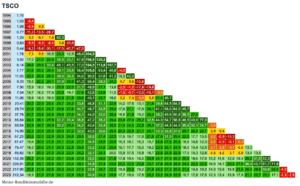
TSCO

TSCO over 29 years - from Dec 1994 until Dec 2023.

19941,10
19951,03-6,4
19961,08-0,94,9
19970,77-11,2-13,5-28,7
19981,253,26,77,662,3
19990,83-5,5-5,3-8,43,8-33,6
20000,44-14,2-15,6-20,1-17,0-40,7-47,0
20011,787,19,510,523,312,546,4304,5
20023,9217,221,024,038,533,167,8198,5120,2
20038,1424,929,533,448,145,577,0164,5113,8107,7
20047,7721,625,228,039,135,656,4105,063,440,8-4,5
200511,0523,326,829,539,536,554,090,557,841,316,542,2
20069,3319,522,224,131,928,641,366,439,324,24,79,6-15,6
20077,5015,918,019,325,622,031,749,927,113,9-2,0-1,2-17,6-19,6
20087,5414,716,517,623,019,727,842,622,911,5-1,5-0,7-12,0-10,10,5
200911,0616,618,519,624,921,929,643,125,716,05,27,30,05,821,446,7
201020,4120,022,023,428,726,233,846,831,122,914,017,513,121,639,664,584,5
201129,7421,423,424,729,827,634,746,732,525,317,621,117,926,141,158,064,045,7
201237,7621,723,624,929,627,634,144,932,025,418,621,919,226,238,249,650,636,027,0
201366,8424,126,127,532,230,436,847,235,329,423,427,025,232,544,054,756,848,549,977,0
201468,5422,924,725,930,228,434,243,432,426,921,424,322,528,337,244,544,035,432,134,72,5
201574,9922,323,925,029,027,232,540,930,625,520,322,921,126,133,338,837,629,726,025,75,99,4
201667,2520,622,022,926,524,829,536,927,422,517,619,717,821,827,631,529,422,017,715,50,2-0,9-10,3
201767,4719,620,921,825,123,427,734,525,520,916,318,116,319,724,627,625,418,614,612,30,2-0,5-5,10,3
201876,4719,320,621,424,522,826,933,224,820,416,117,716,019,223,526,124,018,014,412,52,72,80,76,613,3
201986,8219,120,321,024,022,426,232,124,120,015,917,515,918,722,624,922,917,514,312,64,54,83,78,913,413,5
2020132,2620,221,422,225,123,627,333,025,521,617,819,418,020,924,727,025,320,518,017,010,211,612,018,425,231,552,3
2021226,9121,823,123,926,725,429,134,627,423,820,322,020,823,727,629,928,624,522,522,016,518,720,327,535,443,761,771,6
2022217,9020,821,922,625,324,027,432,625,722,218,920,319,221,825,227,225,821,819,819,214,015,616,521,626,429,935,928,4-4,0
2023212,3419,921,021,624,122,826,030,824,320,917,719,017,820,223,224,923,519,717,817,012,313,413,917,921,122,725,117,1-3,3-2,6

Trane Technologies ⭐

Climate Technology, $17.5 billion in revenue, 40,000 employees

The US-Irish company produces heat pumps, air conditioners, and ventilation systems. Formerly known as Ingersoll-Rand, a company with the same name still exists; don’t confuse the two.
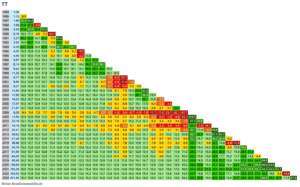
TT

TT over 38 years - from Dec 1985 until Dec 2023.

19851,06
19861,158,5
19871,8933,564,3
19881,8821,027,9-0,5
19892,8327,835,022,450,5
19902,1615,317,14,67,2-23,7
19913,2720,723,214,720,37,551,4
19923,5518,820,713,417,27,828,28,6
19934,7620,722,516,620,413,930,120,734,1
19944,0015,916,911,313,47,216,76,96,1-16,0
19954,5515,716,511,613,58,216,18,68,6-2,213,8
19965,8716,817,713,415,311,018,112,413,47,221,129,0
19978,1418,519,515,717,714,120,916,418,114,426,733,838,7
19989,6218,519,415,917,714,620,516,718,115,124,528,328,018,2
199911,3518,519,316,117,814,920,216,818,115,623,225,724,618,118,0
20008,7715,115,612,513,710,815,011,612,09,114,014,010,62,5-4,5-22,7
20018,9014,214,611,712,710,013,710,510,88,112,111,88,72,3-2,6-11,41,5
20029,3113,614,011,212,19,612,910,010,17,711,110,88,02,7-0,8-6,43,04,6
200314,9015,816,313,814,812,616,013,513,912,115,716,014,210,69,17,019,329,460,0
200417,8616,016,514,115,113,116,314,014,412,816,116,414,911,910,99,519,526,138,519,9
200518,2215,315,713,414,312,315,313,113,411,814,814,913,410,69,68,215,719,625,110,62,0
200617,9714,414,712,613,411,514,212,012,310,813,313,311,89,28,16,812,715,117,96,40,3-1,4
200721,6714,715,013,013,712,014,512,512,811,413,913,912,610,39,48,413,816,018,49,86,79,120,6
20088,299,49,47,37,75,87,85,65,43,85,34,72,90,2-1,5-3,4-0,7-1,0-1,9-11,1-17,5-23,1-32,1-61,7
200917,5012,412,610,611,29,511,69,89,88,510,310,18,86,65,64,48,08,89,42,7-0,4-1,0-0,9-10,1111,1
201023,1913,113,311,512,110,512,610,911,09,811,611,510,38,47,66,710,211,212,16,54,44,96,62,367,332,5
201115,1510,810,99,19,57,99,78,07,96,68,17,86,54,53,62,45,15,55,60,2-2,3-3,0-3,4-8,622,3-7,0-34,7
201224,2112,312,410,711,29,811,610,010,18,910,510,39,37,56,86,08,89,510,05,53,94,15,12,230,711,42,259,8
201339,6213,814,012,413,011,613,512,012,211,212,812,811,910,49,99,312,313,314,110,39,310,212,010,636,722,719,561,763,7
201441,2813,513,612,112,611,313,111,711,810,812,412,311,410,09,59,011,712,513,29,78,79,511,09,630,718,715,539,730,64,2
201536,6612,512,711,211,610,412,010,610,79,711,111,010,18,78,27,610,010,611,17,86,87,28,26,823,713,19,624,714,8-3,8-11,2
201650,7813,313,512,012,511,312,911,611,710,812,212,211,410,19,79,211,612,312,99,99,19,810,99,925,416,414,027,420,38,610,938,5
201761,5913,513,712,312,811,613,212,012,111,312,612,611,810,610,39,912,112,913,410,710,010,711,811,025,017,015,026,320,511,714,329,621,3
201864,3013,213,412,012,511,412,911,711,811,012,312,211,510,310,09,611,712,312,810,29,610,211,210,422,715,613,622,917,710,211,720,612,54,4
201995,4814,214,313,013,512,414,012,813,012,213,513,512,911,811,511,213,414,114,712,311,812,613,713,224,918,517,025,921,715,818,327,023,424,548,5
2020136,9914,915,113,914,313,314,813,713,913,314,614,614,013,112,812,614,715,516,113,913,614,415,615,226,320,619,427,724,219,422,130,228,230,546,043,5
2021193,2815,615,814,615,114,115,614,614,814,115,415,515,014,113,913,815,916,617,315,315,015,917,216,927,422,221,329,026,021,924,731,930,633,144,342,341,1
2022163,5314,614,813,614,013,114,513,513,613,014,214,213,712,812,512,314,214,915,413,413,113,814,814,423,718,817,724,121,017,118,823,821,521,626,319,69,3-15,4
2023241,9415,415,614,414,914,015,414,414,614,015,215,214,813,913,813,615,516,216,815,014,715,516,516,325,220,619,826,023,319,821,726,625,025,630,326,220,911,947,9

TransDigm

Aerospace Supplier, $6.5 billion in revenue, 15,500 employees

TransDigm supplies parts for aircraft manufacturing, including pumps, valves, and electronics. Subsidiaries in Germany are located in Miesbach and Ingolstadt.
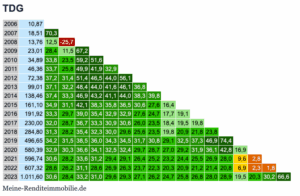
TDG

TDG over 17 years - from Dec 2006 until Dec 2023.

200610,87
200718,5170,3
200813,7612,5-25,7
200923,0128,411,567,2
201034,8933,823,559,251,6
201146,3633,725,849,941,932,9
201272,3837,231,451,446,544,056,1
201399,0137,132,248,444,041,646,136,8
2014138,4637,433,346,943,241,144,038,339,8
2015161,1034,931,142,138,335,836,530,627,616,4
2016191,9233,329,739,035,432,932,927,624,717,719,1
2017230,0032,028,736,733,330,930,626,023,518,419,519,8
2018284,8031,328,235,432,330,029,625,623,519,820,921,823,8
2019496,6534,231,538,536,034,334,531,730,829,132,537,346,974,4
2020580,3932,930,336,634,132,532,429,728,727,029,231,936,142,816,9
2021596,7430,628,233,631,229,429,126,425,223,224,425,526,928,09,62,8
2022607,3228,626,231,128,626,926,323,722,320,320,921,221,420,86,92,31,8
20231.011,6030,628,433,231,029,629,327,126,224,725,826,828,028,919,520,330,266,6

TSMC

Semiconductors, $72 billion in revenue, 73,000 employees

The world’s largest contract manufacturer of semiconductors and a major customer of ASML. Clients include Apple, Nvidia, and Broadcom. There is some geopolitical risk due to its location in Taiwan. However, we do not believe China will forcibly annex Taiwan. If you think otherwise, simply avoid TSMC.
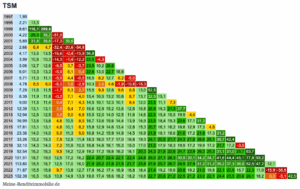
TSM

TSM over 26 years - from Dec 1997 until Dec 2023.

19971,95
19982,2113,3
19998,61110,1289,6
20004,2229,338,2-51,0
20015,8931,838,6-17,339,6
20022,666,44,7-32,4-20,6-54,8
20034,1713,513,5-16,6-0,4-15,956,8
20043,9910,810,3-14,3-1,4-12,222,5-4,3
20055,0612,712,6-8,53,7-3,723,910,226,8
20066,0113,313,3-5,06,10,422,613,022,718,8
20075,7111,311,1-5,04,4-0,516,58,212,76,2-5,0
20084,788,58,0-6,31,6-2,910,32,84,6-1,9-10,8-16,3
20097,2911,611,5-1,76,32,715,59,812,89,66,613,052,5
20108,3911,911,8-0,27,14,015,410,513,210,68,713,732,515,1
20119,0011,511,40,47,14,314,510,112,310,18,412,023,511,17,3
201212,3913,113,12,89,47,016,612,915,213,612,816,826,919,321,537,7
201312,9412,612,53,09,06,815,512,014,012,511,614,622,015,415,519,94,4
201416,9913,613,64,610,58,516,713,615,614,413,916,923,518,419,323,617,131,3
201517,8113,113,14,610,18,215,812,914,613,412,815,320,716,116,218,612,917,34,8
201623,3614,014,06,011,39,616,814,215,914,914,516,921,918,118,621,017,221,817,331,2
201733,2615,215,37,812,911,418,316,017,717,016,819,324,120,921,724,321,826,625,136,742,4
201832,1014,314,37,211,910,516,814,616,115,315,017,021,017,918,319,917,219,917,221,717,2-3,5
201952,5416,216,39,514,212,919,217,218,818,218,120,324,321,822,624,722,926,325,331,131,025,763,7
2020101,5118,719,012,517,216,222,420,722,422,122,424,829,027,128,330,930,134,234,741,644,445,177,893,2
2021113,8018,518,712,517,016,021,920,221,821,521,723,827,625,726,728,927,931,231,236,237,336,052,547,212,1
202271,8715,515,69,713,812,717,916,217,416,916,818,421,419,219,620,819,221,019,822,120,616,722,311,0-15,9-36,8
2023102,3916,516,610,914,913,919,017,418,618,218,219,822,720,821,222,521,223,022,124,423,520,626,118,20,3-5,142,5

UnitedHealth

Insurance, $371 billion in revenue, 400,000 employees

Major health insurer in the US.

UNH

UNH over 38 years - from Dec 1985 until Dec 2023.

19850,25
19860,21-16,0
19870,09-40,0-57,1
19880,11-23,9-27,622,2
19890,304,712,682,6172,7
19900,5818,328,986,1129,693,3
19911,8539,654,5112,9156,2148,3219,0
19922,8341,454,399,3125,2111,3120,953,0
19933,7740,451,186,4102,888,386,642,833,2
19944,4937,846,674,885,671,866,834,426,019,1
19956,5138,546,570,879,167,062,237,032,031,445,0
19964,4830,035,854,458,947,140,619,312,25,9-0,1-31,2
19974,9528,233,349,352,642,035,817,811,87,03,3-12,810,5
19984,2924,428,642,144,234,428,412,87,22,6-1,1-13,0-2,1-13,3
19995,3024,428,240,442,233,327,914,19,45,83,4-5,05,83,523,5
200012,2429,633,745,948,140,135,723,420,118,318,213,528,635,268,9130,9
200114,1328,732,443,545,337,933,722,519,618,017,813,825,830,048,863,315,4
200216,6728,031,441,643,136,232,322,119,418,017,814,424,527,540,446,516,718,0
200323,2428,631,941,542,936,432,823,521,119,920,017,226,529,440,244,723,828,239,4
200435,1929,732,942,143,437,434,125,423,422,522,920,629,432,342,046,030,235,545,351,4
200549,6930,333,342,043,337,634,526,524,724,024,422,530,733,441,945,232,336,943,946,241,2
200642,9927,830,538,439,333,930,923,321,520,620,718,725,427,133,434,923,324,926,722,810,5-13,5
200746,5926,829,336,737,532,429,422,320,519,719,717,823,725,130,331,221,022,022,819,09,8-3,28,4
200821,3121,323,429,730,125,222,215,513,412,211,89,613,914,217,416,77,26,04,2-1,7-11,8-24,6-29,6-54,3
200924,4621,023,029,029,324,621,815,413,512,412,09,913,914,217,116,58,07,15,60,9-7,0-16,2-17,1-27,514,8
201029,2321,022,828,628,924,421,715,613,912,812,410,514,314,617,316,89,18,47,33,3-3,0-10,1-9,2-14,417,119,5
201141,5621,723,629,129,425,122,616,815,214,314,012,316,016,419,118,711,811,410,77,52,4-2,9-0,7-2,824,930,342,2
201245,1121,222,928,228,524,421,916,414,814,013,712,115,515,918,317,911,511,110,57,63,2-1,40,8-0,620,622,624,28,5
201363,6321,923,628,729,025,022,717,416,015,215,013,516,917,319,719,413,513,412,910,66,83,15,85,324,527,029,623,741,1
201486,8322,424,029,029,325,423,218,216,816,116,014,617,918,420,720,515,015,014,712,79,56,49,29,326,428,831,327,838,736,5
2015102,6422,223,828,628,825,223,018,216,916,216,114,817,918,320,520,315,215,215,013,210,27,510,210,425,227,028,625,431,527,018,2
2016142,6822,724,328,929,225,623,619,017,717,117,015,818,919,421,521,416,616,716,615,012,410,112,713,226,828,730,228,033,430,928,239,0
2017199,5223,224,829,329,526,124,119,718,618,017,916,819,820,322,422,317,818,018,016,614,312,315,015,728,230,031,629,934,633,132,039,439,8
2018228,4922,924,428,829,025,723,819,518,417,817,816,719,620,022,021,917,717,817,816,514,312,514,915,626,828,229,327,631,029,127,430,626,514,5
2019273,1522,824,328,528,725,523,619,518,417,917,916,819,620,021,921,817,817,917,916,714,612,915,315,926,127,328,226,529,327,525,827,724,217,019,5
2020331,2722,824,228,328,425,423,619,618,518,018,017,019,620,121,821,817,918,118,116,915,013,515,716,325,726,727,525,928,326,625,026,423,418,420,421,3
2021481,1823,424,728,728,925,924,220,419,418,918,918,020,621,022,822,719,119,319,418,316,615,217,518,127,128,229,027,830,128,827,729,427,524,628,232,745,3
2022514,6522,924,228,028,225,323,619,918,918,518,517,620,020,422,122,018,518,718,717,716,114,716,817,425,526,427,025,727,626,124,925,923,820,922,523,524,67,0
2023518,5722,323,527,227,324,522,919,318,317,817,816,919,219,621,121,017,717,817,816,815,213,915,816,323,724,424,823,424,923,322,022,420,217,317,817,416,13,80,8

United Rentals ⭐

Construction Equipment Rental, $14 billion in revenue, 25,000 employees

The world’s largest rental provider of industrial and construction equipment with over 1,600 locations in North America and more than 4,000 product categories, including forklifts, lifts, pumps, and generators. A nearly boring field of activity that outperforms many high-tech companies, similar to Quanta Services.
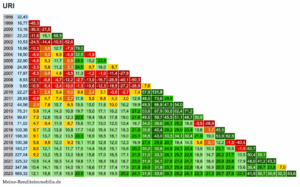
URI

URI over 25 years - from Dec 1998 until Dec 2023.

199832,43
199916,77-48,3
200013,16-36,3-21,5
200122,22-11,815,168,9
200210,53-24,5-14,4-10,5-52,6
200318,86-10,33,012,7-7,979,0
200418,50-8,92,08,9-5,932,5-1,9
200522,90-4,85,311,70,829,510,223,8
200624,90-3,35,811,22,324,09,716,08,7
200717,97-6,30,94,6-3,511,3-1,2-1,0-11,4-27,8
20088,93-12,1-6,8-4,7-12,2-2,7-13,9-16,7-26,9-40,1-50,3
20099,60-10,5-5,4-3,4-10,0-1,3-10,6-12,3-19,5-27,2-26,97,6
201022,27-3,12,65,40,09,82,43,1-0,6-2,77,457,9131,9
201128,93-0,94,77,42,711,95,56,64,03,012,648,073,629,9
201244,562,37,810,76,515,510,011,610,010,219,949,566,841,554,0
201376,315,911,414,510,819,715,017,116,217,427,253,667,950,862,471,2
201499,877,312,615,612,320,616,418,417,819,027,849,559,745,551,149,730,9
201571,024,79,411,98,715,811,713,012,012,418,734,539,626,125,216,8-3,5-28,9
2016103,366,711,313,810,817,714,015,414,715,321,535,840,429,229,023,410,61,745,5
2017168,309,113,716,213,520,316,918,518,119,025,138,643,033,534,130,421,919,053,962,8
2018100,385,89,912,09,315,111,812,812,012,316,927,429,820,719,414,55,60,112,2-1,5-40,4
2019163,278,012,114,211,717,514,415,615,115,620,230,232,824,824,120,413,510,323,116,5-1,562,7
2020227,049,213,215,313,018,615,817,016,517,121,531,033,326,125,722,616,914,726,221,710,550,439,1
2021325,3210,514,416,514,419,817,118,418,018,723,031,934,127,627,424,719,918,428,925,817,948,041,243,3
2022347,9610,414,116,114,019,116,617,717,417,921,829,931,825,725,422,818,416,925,522,415,636,428,723,87,0
2023569,3212,115,817,815,920,918,619,819,520,224,131,933,928,328,226,122,321,329,727,622,541,536,735,932,363,6

French Withholding Tax Slightly Burdensome

The procedure around the French withholding tax for dividends slightly reduces the attractiveness of the otherwise appealing French luxury stocks. The DKB stands out as a broker that, unlike others, assists investors with this small paperwork burden every three years and does so at low cost. If you’re interested in Hermès and similar companies, consider opening an account with DKB. More information can be found in this video

Share on